| Red | Green | Blue | |
| z | 17.64 | ||
| znorm | Inf | ||
| sky | -Inf | -Inf | -Inf |
| S/N | 25.1 | 47.2 | 51.2 |
| S/N(c) | 61.8 | 53.9 | 53.1 |
| SN(E/C) |
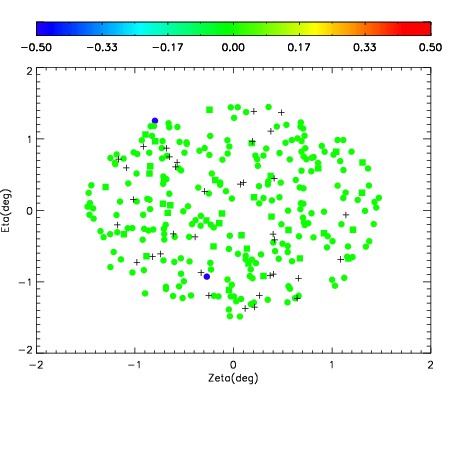
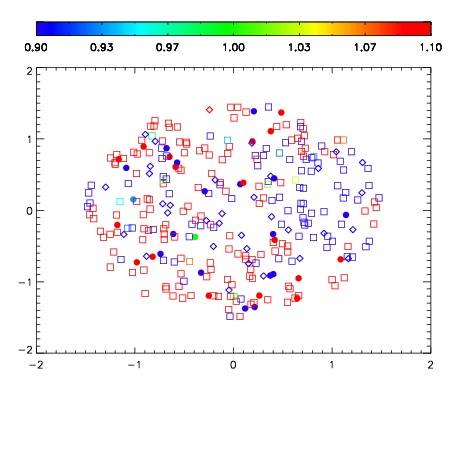
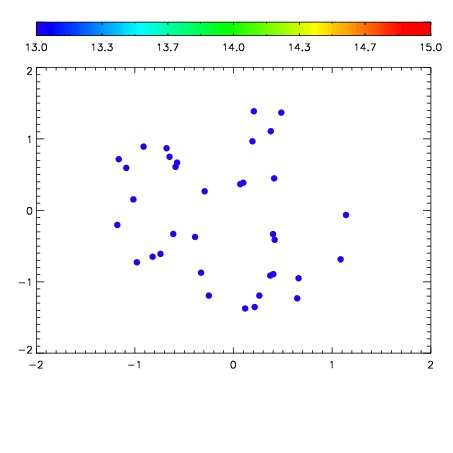

| Frame | Nreads | Zeropoints | Mag plots | Spatial mag deviation | Spatial sky 16325A emission deviations (filled: sky, open: star) | Spatial sky continuum emission | Spatial sky telluric CO2 absorption deviations (filled: H < 10) | |||||||||||||||||||||||
| 0 | 0 |
|
|
|
|
|
|
| IPAIR | NAME | SHIFT | NEWSHIFT | S/N | NAME | SHIFT | NEWSHIFT | S/N |
| 0 | 15470055 | 0.496176 | 0.00000 | 19.0719 | 15470053 | 0.00209311 | 0.494083 | 19.1345 |
| 1 | 15470050 | 0.495551 | 0.000625014 | 19.2063 | 15470049 | 0.00000 | 0.496176 | 19.1921 |
| 2 | 15470051 | 0.495872 | 0.000304013 | 19.1857 | 15470052 | 0.00133734 | 0.494839 | 19.1434 |
| 3 | 15470054 | 0.496047 | 0.000129014 | 19.0628 | 15470056 | 0.00201689 | 0.494159 | 18.8445 |