| Red | Green | Blue | |
| z | 17.64 | ||
| znorm | Inf | ||
| sky | -Inf | -Inf | -Inf |
| S/N | 23.3 | 42.5 | 45.6 |
| S/N(c) | 36.3 | 77.2 | 52.1 |
| SN(E/C) |
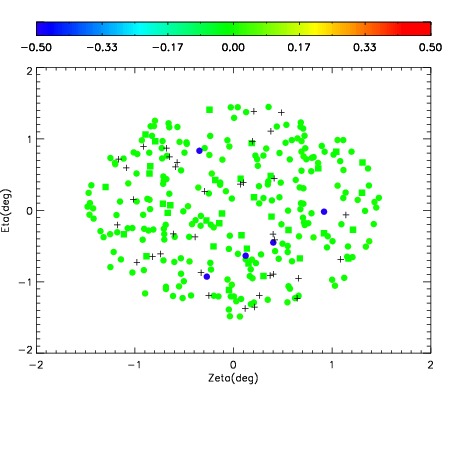
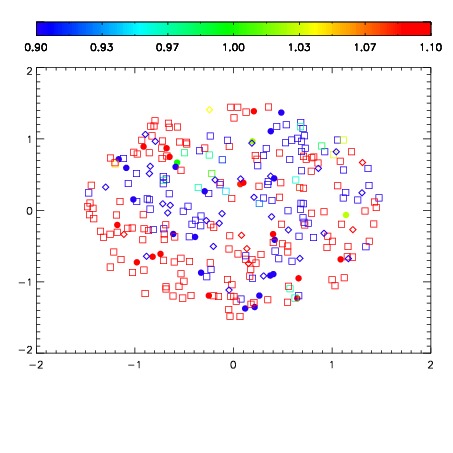
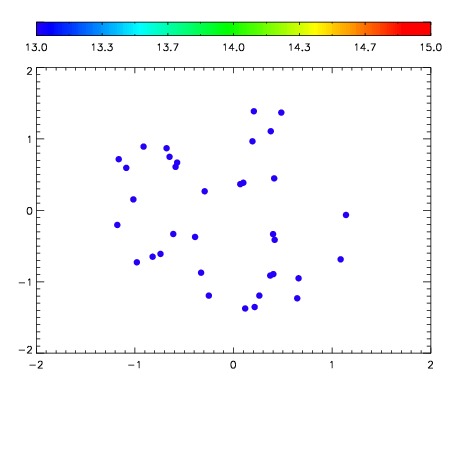

| Frame | Nreads | Zeropoints | Mag plots | Spatial mag deviation | Spatial sky 16325A emission deviations (filled: sky, open: star) | Spatial sky continuum emission | Spatial sky telluric CO2 absorption deviations (filled: H < 10) | |||||||||||||||||||||||
| 0 | 0 |
|
|
|
|
|
|
| IPAIR | NAME | SHIFT | NEWSHIFT | S/N | NAME | SHIFT | NEWSHIFT | S/N |
| 0 | 15510019 | 0.498299 | 0.00000 | 18.9924 | 15510017 | 0.00000 | 0.498299 | 18.9339 |
| 1 | 15510018 | 0.498105 | 0.000194013 | 18.9051 | 15510021 | 0.00172319 | 0.496576 | 18.8879 |
| 2 | 15510022 | 0.494741 | 0.00355801 | 18.8997 | 15510020 | 0.00177318 | 0.496526 | 18.8623 |
| 3 | 15510023 | 0.494394 | 0.00390500 | 18.8969 | 15510024 | 0.000498746 | 0.497800 | 18.7075 |