| Red | Green | Blue | |
| z | 17.65 | ||
| znorm | Inf | ||
| sky | -Inf | -Inf | -Inf |
| S/N | 11.2 | 23.7 | 24.9 |
| S/N(c) | 17.1 | 24.1 | 56.4 |
| SN(E/C) |
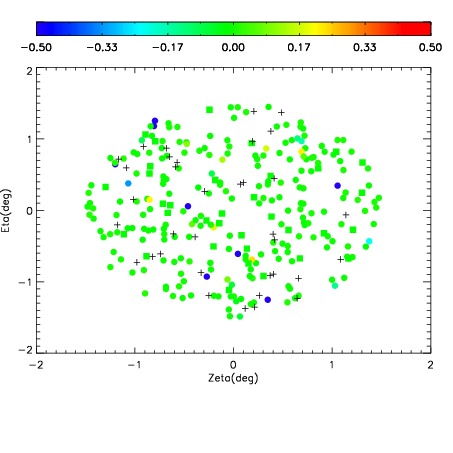
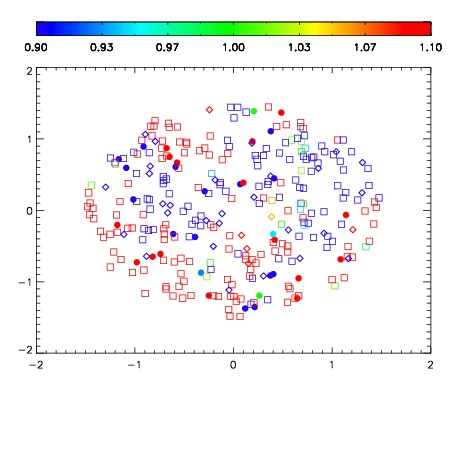
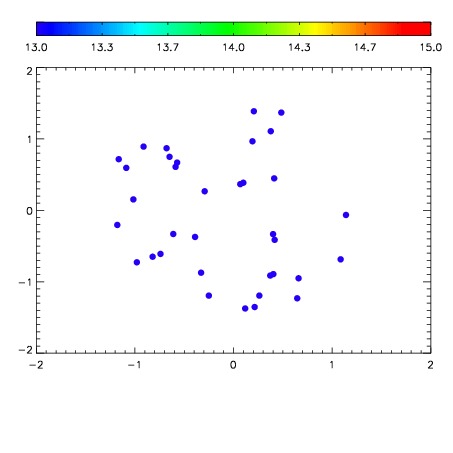

| Frame | Nreads | Zeropoints | Mag plots | Spatial mag deviation | Spatial sky 16325A emission deviations (filled: sky, open: star) | Spatial sky continuum emission | Spatial sky telluric CO2 absorption deviations (filled: H < 10) | |||||||||||||||||||||||
| 0 | 0 |
|
|
|
|
|
|
| IPAIR | NAME | SHIFT | NEWSHIFT | S/N | NAME | SHIFT | NEWSHIFT | S/N |
| 0 | 15580042 | 0.492056 | 0.00000 | 17.8101 | 15580047 | 0.00162732 | 0.490429 | 17.5696 |
| 1 | 15580041 | 0.491403 | 0.000652999 | 18.3133 | 15580040 | 0.00000 | 0.492056 | 18.5210 |
| 2 | 15580046 | 0.491207 | 0.000849009 | 17.9219 | 15580044 | 0.00106964 | 0.490986 | 17.8147 |
| 3 | 15580045 | 0.490846 | 0.00121000 | 17.8954 | 15580043 | 0.00156423 | 0.490492 | 17.6646 |