| Red | Green | Blue | |
| z | 17.64 | ||
| znorm | Inf | ||
| sky | -Inf | -Inf | -Inf |
| S/N | 22.4 | 41.7 | 46.5 |
| S/N(c) | 20.6 | 83.9 | 80.4 |
| SN(E/C) |
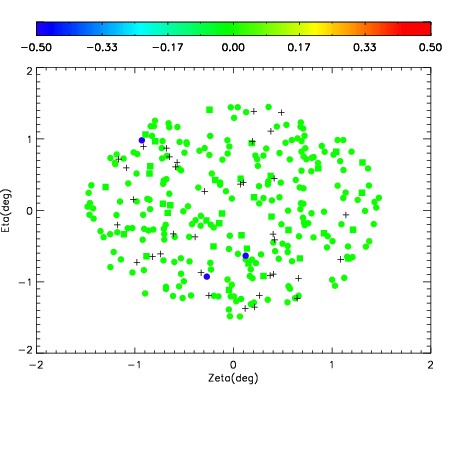
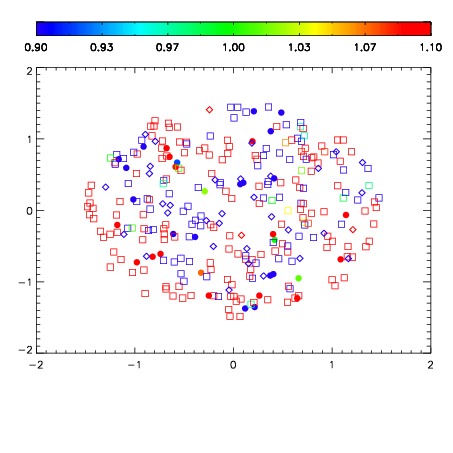
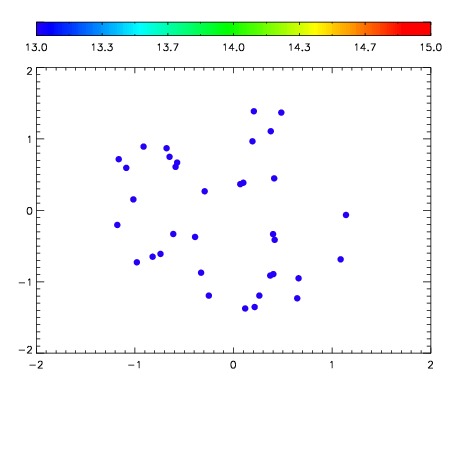

| Frame | Nreads | Zeropoints | Mag plots | Spatial mag deviation | Spatial sky 16325A emission deviations (filled: sky, open: star) | Spatial sky continuum emission | Spatial sky telluric CO2 absorption deviations (filled: H < 10) | |||||||||||||||||||||||
| 0 | 0 |
|
|
|
|
|
|
| IPAIR | NAME | SHIFT | NEWSHIFT | S/N | NAME | SHIFT | NEWSHIFT | S/N |
| 0 | 15750013 | 0.486808 | 0.00000 | 18.8561 | 15750011 | 0.00000 | 0.486808 | 18.8494 |
| 1 | 15750016 | 0.485428 | 0.00138000 | 18.7873 | 15750014 | -0.000104894 | 0.486913 | 18.8104 |
| 2 | 15750012 | 0.486136 | 0.000672013 | 18.7820 | 15750015 | -0.000501429 | 0.487309 | 18.7527 |
| 3 | 15750017 | 0.486011 | 0.000797004 | 18.7191 | 15750018 | -0.000907220 | 0.487715 | 18.7233 |