| Red | Green | Blue | |
| z | 17.64 | ||
| znorm | Inf | ||
| sky | -NaN | -Inf | -NaN |
| S/N | 23.9 | 43.4 | 46.5 |
| S/N(c) | 21.3 | 83.0 | 56.6 |
| SN(E/C) |


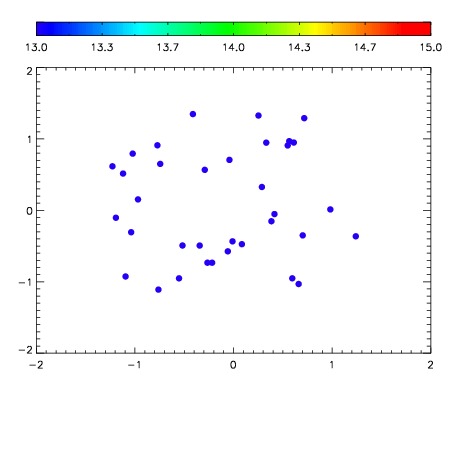

| Frame | Nreads | Zeropoints | Mag plots | Spatial mag deviation | Spatial sky 16325A emission deviations (filled: sky, open: star) | Spatial sky continuum emission | Spatial sky telluric CO2 absorption deviations (filled: H < 10) | |||||||||||||||||||||||
| 0 | 0 |
|
|
|
|
|
|
| IPAIR | NAME | SHIFT | NEWSHIFT | S/N | NAME | SHIFT | NEWSHIFT | S/N |
| 0 | 15300045 | 0.506580 | 0.00000 | 19.0757 | 15300038 | 0.00000 | 0.506580 | 19.0796 |
| 1 | 15300044 | 0.506224 | 0.000356019 | 19.0600 | 15300041 | 0.000424679 | 0.506155 | 19.0653 |
| 2 | 15300043 | 0.505388 | 0.00119197 | 19.0560 | 15300042 | -4.03470e-05 | 0.506620 | 19.0075 |