| Red | Green | Blue | |
| z | 17.64 | ||
| znorm | Inf | ||
| sky | -Inf | -Inf | -NaN |
| S/N | 30.1 | 48.3 | 57.3 |
| S/N(c) | 24.1 | 99.8 | 96.0 |
| SN(E/C) |

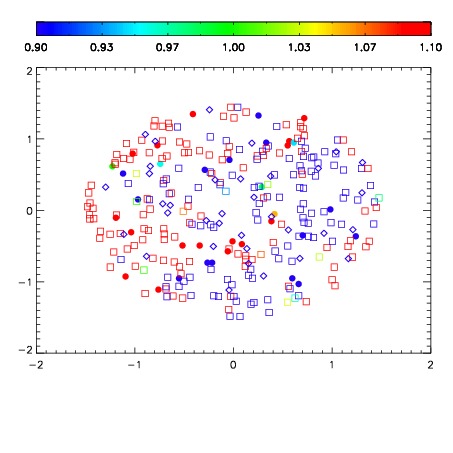


| Frame | Nreads | Zeropoints | Mag plots | Spatial mag deviation | Spatial sky 16325A emission deviations (filled: sky, open: star) | Spatial sky continuum emission | Spatial sky telluric CO2 absorption deviations (filled: H < 10) | |||||||||||||||||||||||
| 0 | 0 |
|
|
|
|
|
|
| IPAIR | NAME | SHIFT | NEWSHIFT | S/N | NAME | SHIFT | NEWSHIFT | S/N |
| 0 | 15480043 | 0.496021 | 0.00000 | 19.1125 | 15480040 | 0.00120482 | 0.494816 | 19.0572 |
| 1 | 15480042 | 0.495262 | 0.000759006 | 19.1281 | 15480037 | 0.00000 | 0.496021 | 19.1279 |
| 2 | 15480038 | 0.494895 | 0.00112599 | 19.1259 | 15480041 | 0.00170845 | 0.494313 | 19.0608 |
| 3 | 15480039 | 0.495393 | 0.000627995 | 19.0929 | 15480044 | 0.00224146 | 0.493780 | 19.0462 |