| Red | Green | Blue | |
| z | 17.64 | ||
| znorm | Inf | ||
| sky | -Inf | -Inf | -NaN |
| S/N | 24.2 | 45.3 | 48.8 |
| S/N(c) | 33.0 | 83.0 | 106.1 |
| SN(E/C) |

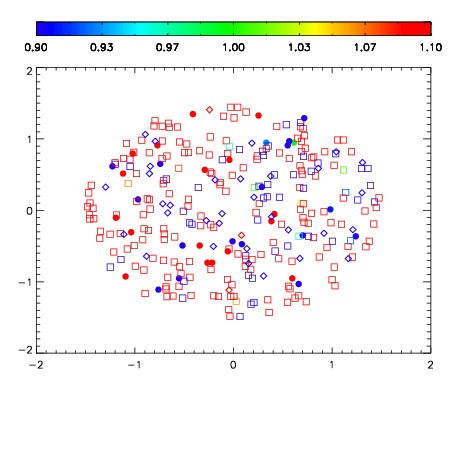


| Frame | Nreads | Zeropoints | Mag plots | Spatial mag deviation | Spatial sky 16325A emission deviations (filled: sky, open: star) | Spatial sky continuum emission | Spatial sky telluric CO2 absorption deviations (filled: H < 10) | |||||||||||||||||||||||
| 0 | 0 |
|
|
|
|
|
|
| IPAIR | NAME | SHIFT | NEWSHIFT | S/N | NAME | SHIFT | NEWSHIFT | S/N |
| 0 | 15570039 | 0.489864 | 0.00000 | 18.9622 | 15570041 | -0.000990321 | 0.490854 | 18.9107 |
| 1 | 15570043 | 0.488716 | 0.00114799 | 18.9825 | 15570044 | -0.000510900 | 0.490375 | 18.9553 |
| 2 | 15570042 | 0.488821 | 0.00104299 | 18.9228 | 15570037 | 0.00000 | 0.489864 | 18.8891 |
| 3 | 15570038 | 0.489862 | 1.99676e-06 | 18.9179 | 15570040 | -0.000335303 | 0.490199 | 18.8882 |