| Red | Green | Blue | |
| z | 17.64 | ||
| znorm | Inf | ||
| sky | -Inf | -Inf | -NaN |
| S/N | 29.8 | 51.1 | 55.7 |
| S/N(c) | 38.5 | 93.1 | 102.1 |
| SN(E/C) |


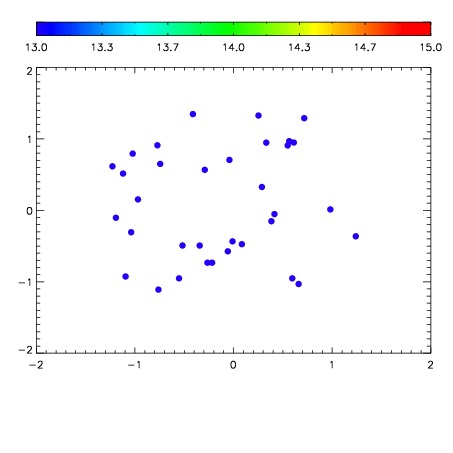

| Frame | Nreads | Zeropoints | Mag plots | Spatial mag deviation | Spatial sky 16325A emission deviations (filled: sky, open: star) | Spatial sky continuum emission | Spatial sky telluric CO2 absorption deviations (filled: H < 10) | |||||||||||||||||||||||
| 0 | 0 |
|
|
|
|
|
|
| IPAIR | NAME | SHIFT | NEWSHIFT | S/N | NAME | SHIFT | NEWSHIFT | S/N |
| 0 | 15820016 | 0.486099 | 0.00000 | 19.1088 | 15820022 | 0.00148785 | 0.484611 | 19.0127 |
| 1 | 15820020 | 0.485586 | 0.000513017 | 19.1382 | 15820015 | 0.00000 | 0.486099 | 19.1202 |
| 2 | 15820021 | 0.485787 | 0.000312001 | 19.1295 | 15820018 | 0.000366461 | 0.485733 | 19.0902 |
| 3 | 15820017 | 0.486093 | 5.99027e-06 | 19.1224 | 15820019 | 0.000258331 | 0.485841 | 19.0702 |