| Red | Green | Blue | |
| z | 17.64 | ||
| znorm | Inf | ||
| sky | -Inf | -Inf | -Inf |
| S/N | 25.4 | 45.8 | 51.3 |
| S/N(c) | 36.4 | 87.3 | 40.9 |
| SN(E/C) |
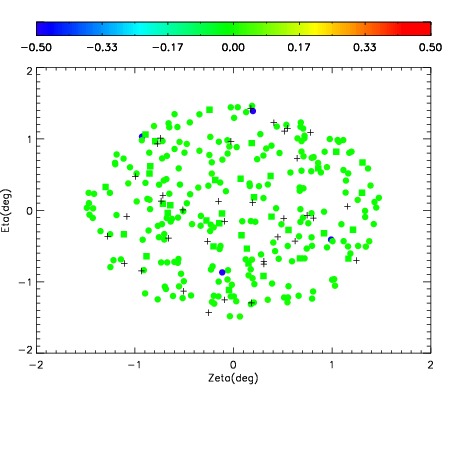
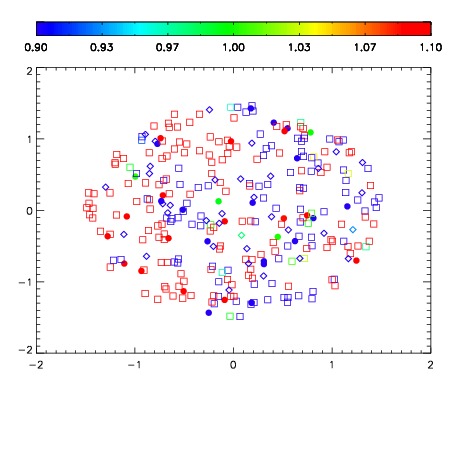
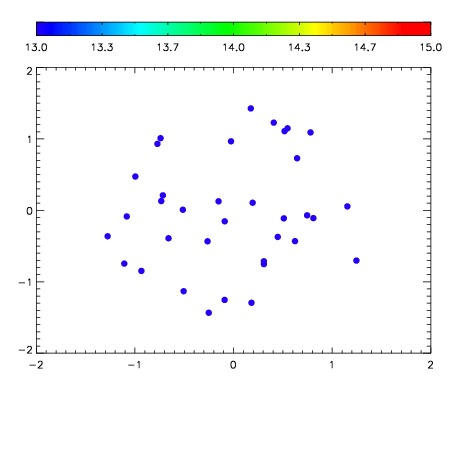

| Frame | Nreads | Zeropoints | Mag plots | Spatial mag deviation | Spatial sky 16325A emission deviations (filled: sky, open: star) | Spatial sky continuum emission | Spatial sky telluric CO2 absorption deviations (filled: H < 10) | |||||||||||||||||||||||
| 0 | 0 |
|
|
|
|
|
|
| IPAIR | NAME | SHIFT | NEWSHIFT | S/N | NAME | SHIFT | NEWSHIFT | S/N |
| 0 | 15480054 | 0.494281 | 0.00000 | 18.9112 | 15480055 | 0.000631738 | 0.493649 | 18.8845 |
| 1 | 15480050 | 0.492767 | 0.00151399 | 19.0994 | 15480051 | 0.000547690 | 0.493733 | 19.1005 |
| 2 | 15480049 | 0.493615 | 0.000665992 | 19.0833 | 15480048 | 0.00000 | 0.494281 | 19.0700 |
| 3 | 15480053 | 0.493349 | 0.000932008 | 18.9917 | 15480052 | 0.000323782 | 0.493957 | 19.0524 |