| Red | Green | Blue | |
| z | 17.64 | ||
| znorm | Inf | ||
| sky | -Inf | -Inf | -Inf |
| S/N | 21.0 | 38.7 | 41.4 |
| S/N(c) | 25.6 | 60.4 | 31.5 |
| SN(E/C) |
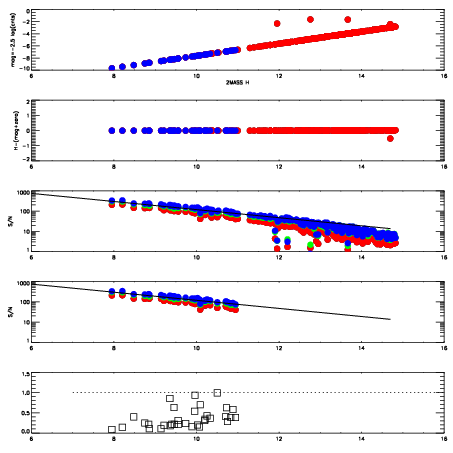
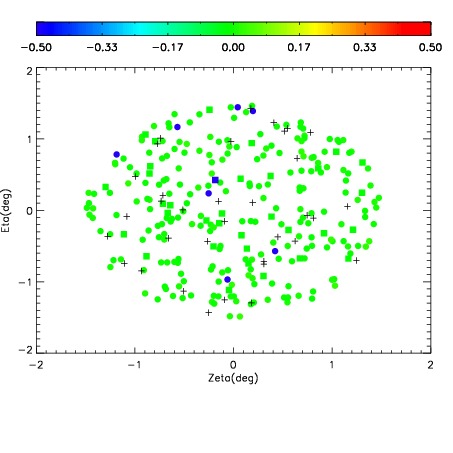
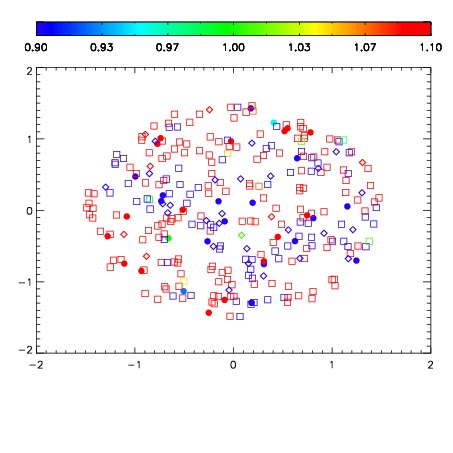
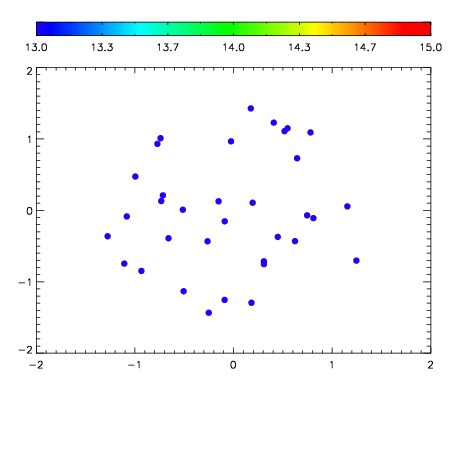

| Frame | Nreads | Zeropoints | Mag plots | Spatial mag deviation | Spatial sky 16325A emission deviations (filled: sky, open: star) | Spatial sky continuum emission | Spatial sky telluric CO2 absorption deviations (filled: H < 10) | |||||||||||||||||||||||
| 0 | 0 |
|
|
|
|
|
|
| IPAIR | NAME | SHIFT | NEWSHIFT | S/N | NAME | SHIFT | NEWSHIFT | S/N |
| 0 | 15790024 | 0.485115 | 0.00000 | 18.7238 | 15790026 | 0.000919357 | 0.484196 | 18.7212 |
| 1 | 15790023 | 0.484763 | 0.000351995 | 18.6955 | 15790022 | 0.00000 | 0.485115 | 18.7145 |
| 2 | 15790027 | 0.484443 | 0.000671983 | 18.6502 | 15790029 | 0.00165683 | 0.483458 | 18.6113 |
| 3 | 15790028 | 0.484689 | 0.000425994 | 18.6423 | 15790025 | 0.000737694 | 0.484377 | 18.5368 |