| Red | Green | Blue | |
| z | 17.64 | ||
| znorm | Inf | ||
| sky | -Inf | -Inf | -NaN |
| S/N | 17.3 | 30.4 | 33.4 |
| S/N(c) | 39.4 | 23.7 | 23.3 |
| SN(E/C) |
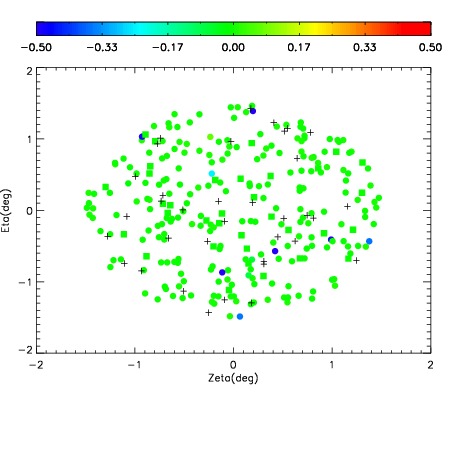
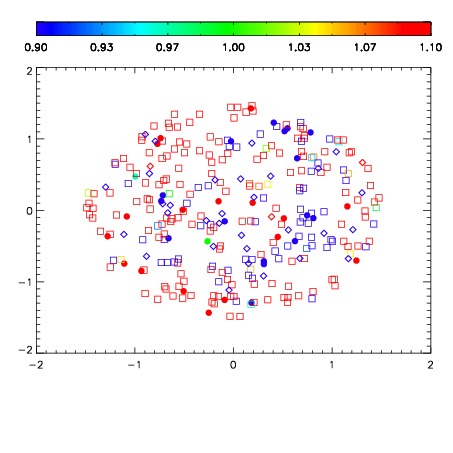
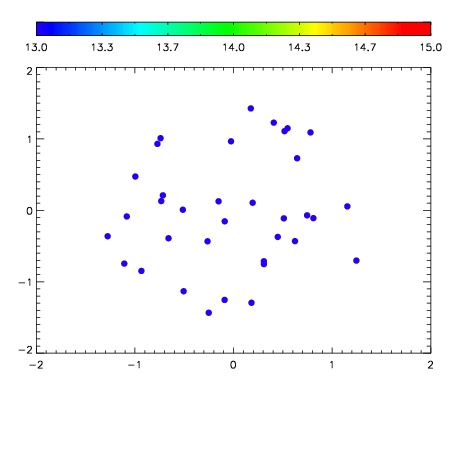

| Frame | Nreads | Zeropoints | Mag plots | Spatial mag deviation | Spatial sky 16325A emission deviations (filled: sky, open: star) | Spatial sky continuum emission | Spatial sky telluric CO2 absorption deviations (filled: H < 10) | |||||||||||||||||||||||
| 0 | 0 |
|
|
|
|
|
|
| IPAIR | NAME | SHIFT | NEWSHIFT | S/N | NAME | SHIFT | NEWSHIFT | S/N |
| 0 | 15820028 | 0.486088 | 0.00000 | 18.8101 | 15820029 | 0.00187489 | 0.484213 | 18.7495 |
| 1 | 15820027 | 0.485221 | 0.000867009 | 19.1433 | 15820026 | 0.00000 | 0.486088 | 19.0978 |