| Red | Green | Blue | |
| z | 17.64 | ||
| znorm | Inf | ||
| sky | -Inf | -Inf | -NaN |
| S/N | 25.6 | 47.0 | 53.5 |
| S/N(c) | 39.8 | 79.0 | 127.9 |
| SN(E/C) |
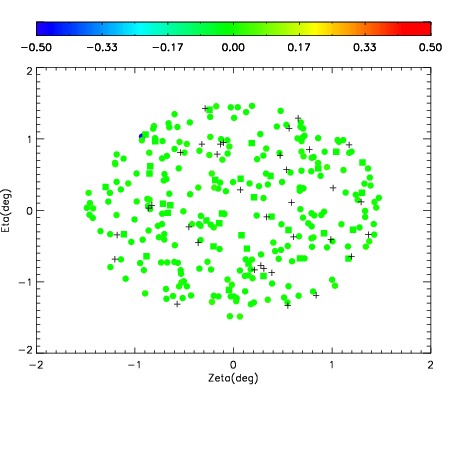

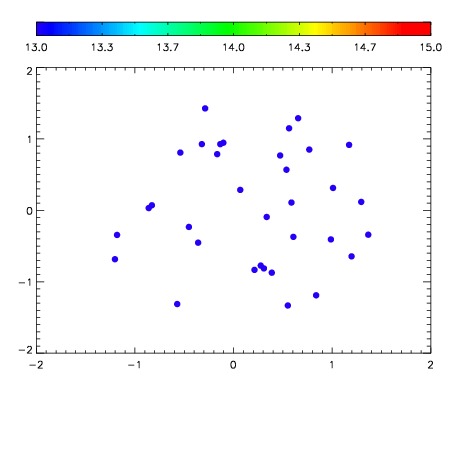

| Frame | Nreads | Zeropoints | Mag plots | Spatial mag deviation | Spatial sky 16325A emission deviations (filled: sky, open: star) | Spatial sky continuum emission | Spatial sky telluric CO2 absorption deviations (filled: H < 10) | |||||||||||||||||||||||
| 0 | 0 |
|
|
|
|
|
|
| IPAIR | NAME | SHIFT | NEWSHIFT | S/N | NAME | SHIFT | NEWSHIFT | S/N |
| 0 | 18270042 | 1.05069e-05 | 0.00000 | 19.1737 | 18270045 | -0.505523 | 0.505534 | 19.2026 |
| 1 | 18270043 | -2.01337e-05 | 3.06406e-05 | 19.1648 | 18270040 | -0.504461 | 0.504471 | 19.1735 |
| 2 | 18270039 | 0.00000 | 1.05069e-05 | 19.1638 | 18270041 | -0.504571 | 0.504582 | 19.1717 |
| 3 | 18270046 | -0.000225444 | 0.000235951 | 19.1568 | 18270044 | -0.505601 | 0.505611 | 19.1556 |