| Frame | Nreads | Zeropoints | Mag plots
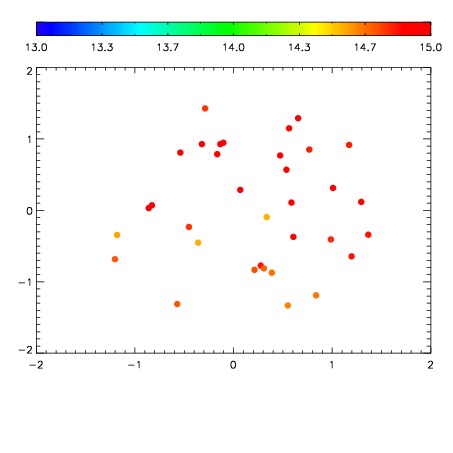
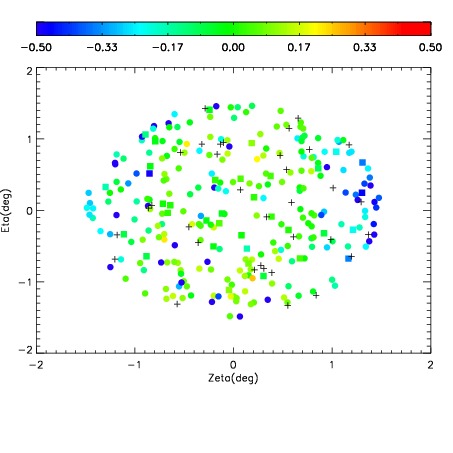
| Spatial mag deviation
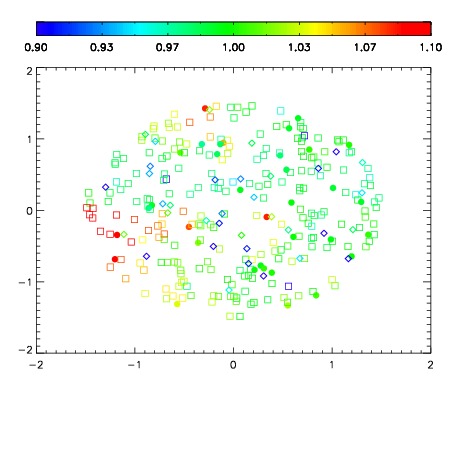
| Spatial sky 16325A emission deviations (filled: sky, open: star)
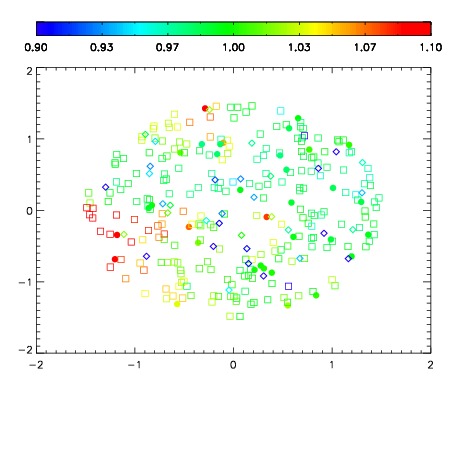
| Spatial sky continuum emission
| Spatial sky telluric CO2 absorption deviations (filled: H < 10)
|
| 18480071
| 94
| | Red | Green | Blue
| | z | | 19.93
| | znorm | | 15.00
| | sky | 15.2 | 14.8 | 15.0
| | S/N | 24.7 | 36.6 | 42.8
| | S/N(c) | 54.2 | 42.7 | 70.4
| | SN(E/C) 0.27
|
| 
| 
| 
| 
| 
|
| 18480072
| 94
| | Red | Green | Blue
| | z | | 19.90
| | znorm | | 14.97
| | sky | 15.1 | 14.9 | 15.0
| | S/N | 24.6 | 36.1 | 42.8
| | S/N(c) | 53.2 | 42.1 | 69.6
| | SN(E/C) 0.28
|
| 
| 
| 
| 
| 
|
| 18480073
| 94
| | Red | Green | Blue
| | z | | 19.85
| | znorm | | 14.92
| | sky | 15.2 | 14.8 | 14.7
| | S/N | 24.2 | 35.0 | 41.4
| | S/N(c) | 52.6 | 41.1 | 68.2
| | SN(E/C) 0.28
|
| 
| 
| 
| 
| 
|
| 18480074
| 94
| | Red | Green | Blue
| | z | | 19.90
| | znorm | | 14.97
| | sky | 15.0 | 14.8 | 14.6
| | S/N | 24.5 | 34.9 | 41.2
| | S/N(c) | 52.6 | 41.6 | 69.1
| | SN(E/C) 0.27
|
| 
| 
| 
| 
| 
|