| Red | Green | Blue | |
| z | 17.64 | ||
| znorm | Inf | ||
| sky | -Inf | -Inf | -NaN |
| S/N | 30.8 | 47.9 | 56.6 |
| S/N(c) | 71.8 | 53.1 | 93.0 |
| SN(E/C) |


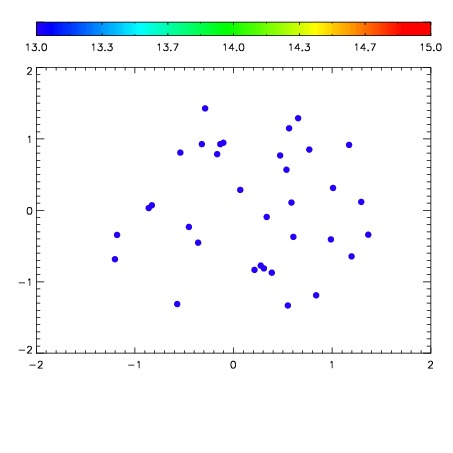

| Frame | Nreads | Zeropoints | Mag plots | Spatial mag deviation | Spatial sky 16325A emission deviations (filled: sky, open: star) | Spatial sky continuum emission | Spatial sky telluric CO2 absorption deviations (filled: H < 10) | |||||||||||||||||||||||
| 0 | 0 |
|
|
|
|
|
|
| IPAIR | NAME | SHIFT | NEWSHIFT | S/N | NAME | SHIFT | NEWSHIFT | S/N |
| 0 | 18480071 | 0.00000 | 0.00000 | 19.9074 | 18480072 | -0.503467 | 0.503467 | 19.8931 |
| 1 | 18480074 | -0.00124605 | 0.00124605 | 19.8727 | 18480073 | -0.503878 | 0.503878 | 19.8406 |