| Red | Green | Blue | |
| z | 17.64 | ||
| znorm | Inf | ||
| sky | -Inf | -Inf | -Inf |
| S/N | 11.1 | 23.9 | 26.8 |
| S/N(c) | 19.4 | 39.5 | 66.3 |
| SN(E/C) |
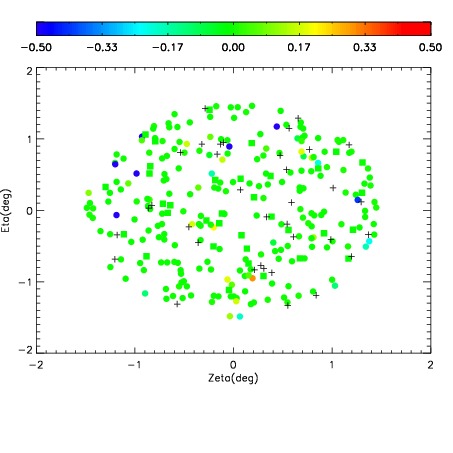
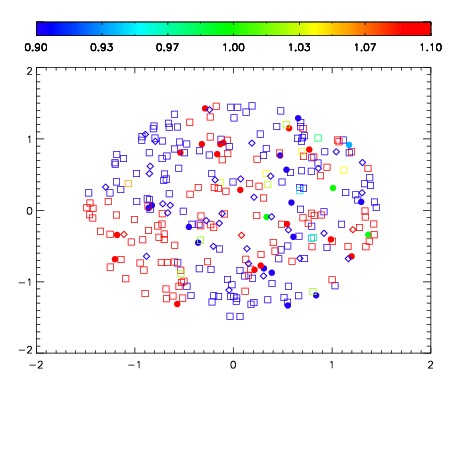
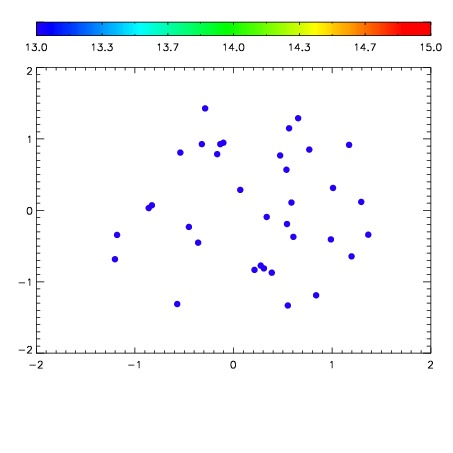

| Frame | Nreads | Zeropoints | Mag plots | Spatial mag deviation | Spatial sky 16325A emission deviations (filled: sky, open: star) | Spatial sky continuum emission | Spatial sky telluric CO2 absorption deviations (filled: H < 10) | |||||||||||||||||||||||
| 0 | 0 |
|
|
|
|
|
|
| IPAIR | NAME | SHIFT | NEWSHIFT | S/N | NAME | SHIFT | NEWSHIFT | S/N |
| 0 | 18510069 | 0.494618 | 0.00000 | 18.4872 | 18510071 | 0.000662778 | 0.493955 | 18.4844 |
| 1 | 18510070 | 0.494558 | 5.99921e-05 | 18.5252 | 18510068 | 0.00000 | 0.494618 | 18.5931 |