| Red | Green | Blue | |
| z | 17.64 | ||
| znorm | Inf | ||
| sky | -Inf | -Inf | -NaN |
| S/N | 25.4 | 43.4 | 51.4 |
| S/N(c) | 70.5 | 80.5 | 70.5 |
| SN(E/C) |
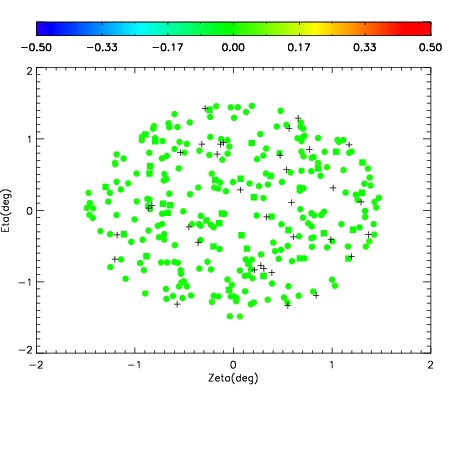
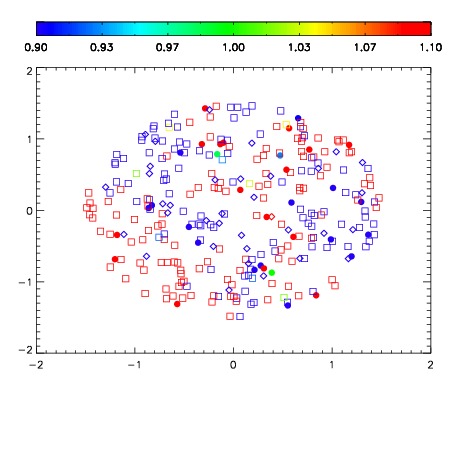


| Frame | Nreads | Zeropoints | Mag plots | Spatial mag deviation | Spatial sky 16325A emission deviations (filled: sky, open: star) | Spatial sky continuum emission | Spatial sky telluric CO2 absorption deviations (filled: H < 10) | |||||||||||||||||||||||
| 0 | 0 |
|
|
|
|
|
|
| IPAIR | NAME | SHIFT | NEWSHIFT | S/N | NAME | SHIFT | NEWSHIFT | S/N |
| 0 | 18540045 | 0.493485 | 0.00000 | 19.1845 | 18540043 | 0.000804484 | 0.492681 | 19.1951 |
| 1 | 18540041 | 0.492528 | 0.000957012 | 19.1547 | 18540044 | 0.00115979 | 0.492325 | 19.1743 |
| 2 | 18540042 | 0.493470 | 1.49906e-05 | 19.1391 | 18540040 | 0.00000 | 0.493485 | 19.1415 |
| 3 | 18540046 | 0.493392 | 9.30130e-05 | 19.1297 | 18540047 | 0.00361385 | 0.489871 | 19.1153 |