| Red | Green | Blue | |
| z | 17.64 | ||
| znorm | Inf | ||
| sky | -Inf | -Inf | -Inf |
| S/N | 29.2 | 51.9 | 58.3 |
| S/N(c) | 0.0 | 0.0 | 0.0 |
| SN(E/C) |
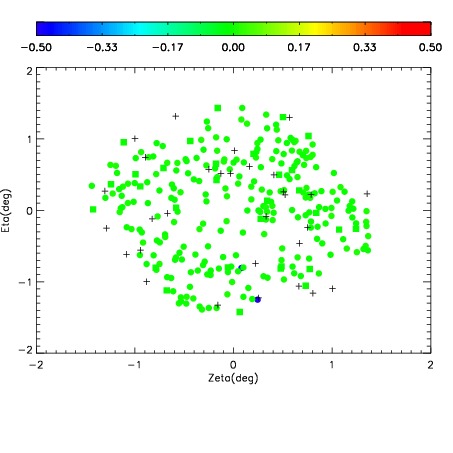
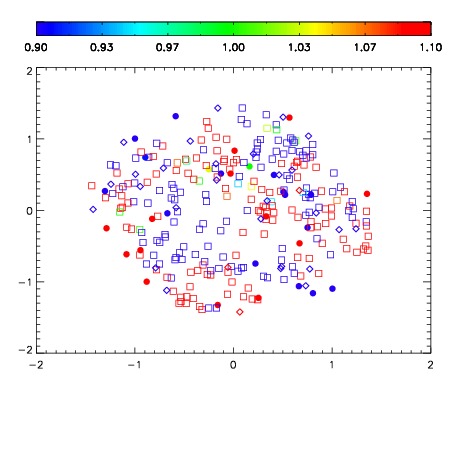


| Frame | Nreads | Zeropoints | Mag plots | Spatial mag deviation | Spatial sky 16325A emission deviations (filled: sky, open: star) | Spatial sky continuum emission | Spatial sky telluric CO2 absorption deviations (filled: H < 10) | |||||||||||||||||||||||
| 0 | 0 |
|
|
|
|
|
|
| IPAIR | NAME | SHIFT | NEWSHIFT | S/N | NAME | SHIFT | NEWSHIFT | S/N |
| 0 | 15510056 | 0.000652120 | 0.00000 | 19.1850 | 15510053 | -0.490284 | 0.490936 | 19.1785 |
| 1 | 15510055 | 0.000135851 | 0.000516269 | 19.1714 | 15510054 | -0.490244 | 0.490896 | 19.1674 |
| 2 | 15510052 | 0.00000 | 0.000652120 | 19.1321 | 15510057 | -0.490442 | 0.491094 | 19.1521 |
| 3 | 15510059 | -0.000846616 | 0.00149874 | 19.0066 | 15510058 | -0.490374 | 0.491026 | 19.1245 |