| Red | Green | Blue | |
| z | 17.64 | ||
| znorm | Inf | ||
| sky | -Inf | -Inf | -Inf |
| S/N | 28.5 | 52.1 | 57.1 |
| S/N(c) | 0.0 | 0.0 | 0.0 |
| SN(E/C) |
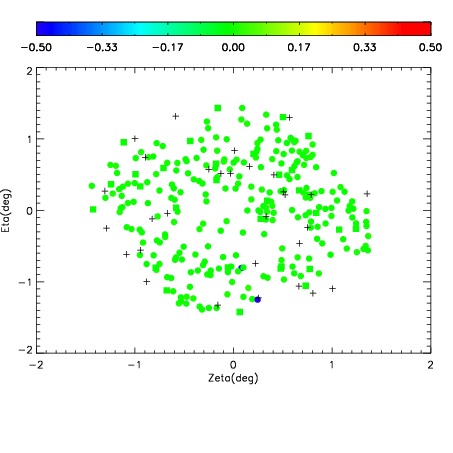
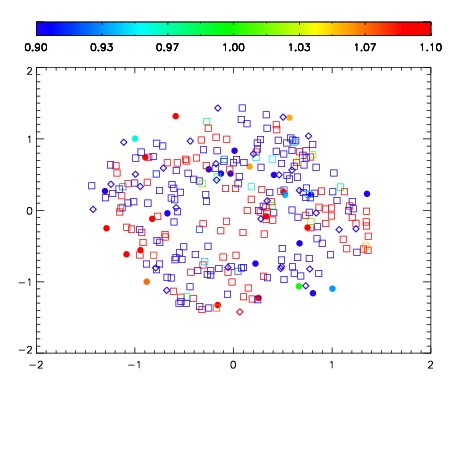


| Frame | Nreads | Zeropoints | Mag plots | Spatial mag deviation | Spatial sky 16325A emission deviations (filled: sky, open: star) | Spatial sky continuum emission | Spatial sky telluric CO2 absorption deviations (filled: H < 10) | |||||||||||||||||||||||
| 0 | 0 |
|
|
|
|
|
|
| IPAIR | NAME | SHIFT | NEWSHIFT | S/N | NAME | SHIFT | NEWSHIFT | S/N |
| 0 | 15590081 | 0.00192537 | 0.00000 | 18.9080 | 15590078 | -0.487367 | 0.489292 | 18.9200 |
| 1 | 15590076 | 0.000227729 | 0.00169764 | 18.9744 | 15590074 | -0.486350 | 0.488275 | 19.0573 |
| 2 | 15590077 | 0.000958802 | 0.000966568 | 18.9685 | 15590075 | -0.486106 | 0.488031 | 19.0089 |
| 3 | 15590073 | 0.00000 | 0.00192537 | 18.9500 | 15590082 | -0.486369 | 0.488294 | 18.9827 |
| 4 | 15590080 | 0.00122576 | 0.000699610 | 18.8590 | 15590079 | -0.486955 | 0.488880 | 18.9078 |