| Red | Green | Blue | |
| z | 17.65 | ||
| znorm | Inf | ||
| sky | -Inf | -Inf | -Inf |
| S/N | 19.6 | 37.0 | 40.1 |
| S/N(c) | 0.0 | 0.0 | 0.0 |
| SN(E/C) |
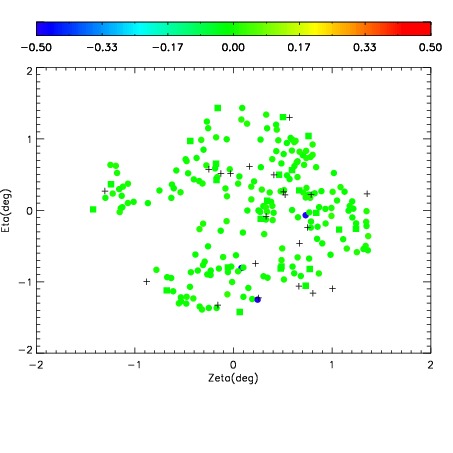
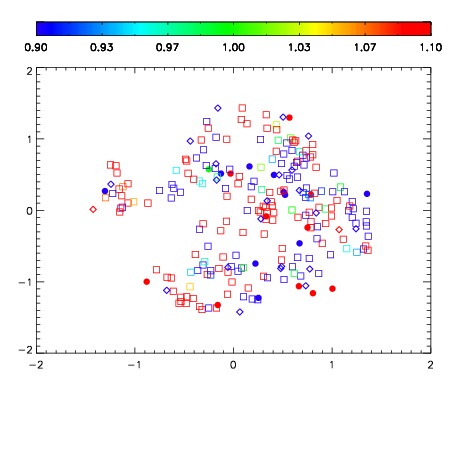
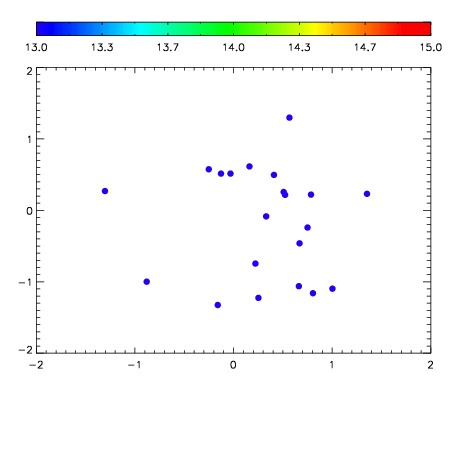

| Frame | Nreads | Zeropoints | Mag plots | Spatial mag deviation | Spatial sky 16325A emission deviations (filled: sky, open: star) | Spatial sky continuum emission | Spatial sky telluric CO2 absorption deviations (filled: H < 10) | |||||||||||||||||||||||
| 0 | 0 |
|
|
|
|
|
|
| IPAIR | NAME | SHIFT | NEWSHIFT | S/N | NAME | SHIFT | NEWSHIFT | S/N |
| 0 | 16400016 | 0.490627 | 0.00000 | 18.3772 | 16400015 | -0.00235490 | 0.492982 | 17.8578 |
| 1 | 16400012 | 0.488815 | 0.00181198 | 18.6557 | 16400018 | -0.00329099 | 0.493918 | 18.7788 |
| 2 | 16400017 | 0.490349 | 0.000277996 | 18.6496 | 16400011 | 0.00000 | 0.490627 | 18.7524 |
| 3 | 16400013 | 0.490174 | 0.000452995 | 18.5151 | 16400014 | -0.00317499 | 0.493802 | 18.5159 |