| Red | Green | Blue | |
| z | 17.64 | ||
| znorm | Inf | ||
| sky | -Inf | -Inf | -NaN |
| S/N | 22.0 | 38.8 | 47.1 |
| S/N(c) | 0.0 | 0.0 | 0.0 |
| SN(E/C) |
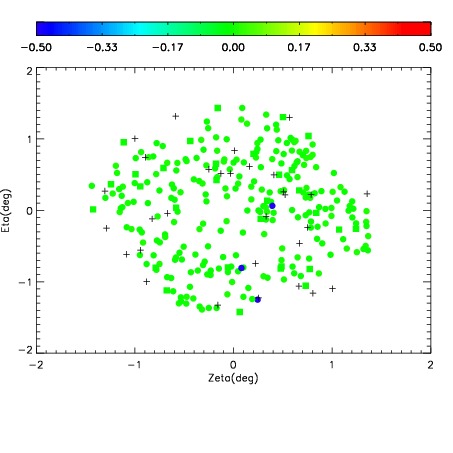
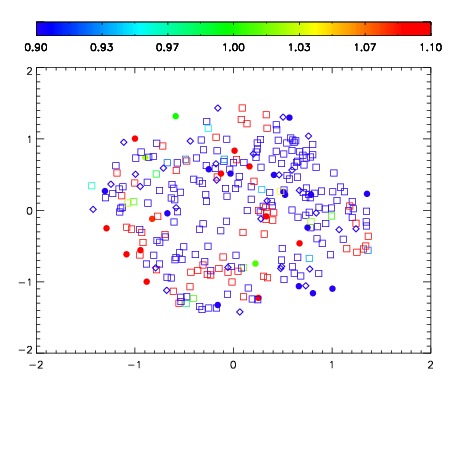


| Frame | Nreads | Zeropoints | Mag plots | Spatial mag deviation | Spatial sky 16325A emission deviations (filled: sky, open: star) | Spatial sky continuum emission | Spatial sky telluric CO2 absorption deviations (filled: H < 10) | |||||||||||||||||||||||
| 0 | 0 |
|
|
|
|
|
|
| IPAIR | NAME | SHIFT | NEWSHIFT | S/N | NAME | SHIFT | NEWSHIFT | S/N |
| 0 | 19920035 | 0.505095 | 0.00000 | 18.9550 | 19920033 | 0.00000 | 0.505095 | 18.8255 |
| 1 | 19920038 | 0.505019 | 7.59959e-05 | 19.0264 | 19920037 | 0.00859280 | 0.496502 | 19.0247 |
| 2 | 19920034 | 0.504340 | 0.000755012 | 18.9688 | 19920036 | 0.00843302 | 0.496662 | 18.9941 |