| Red | Green | Blue | |
| z | 17.64 | ||
| znorm | Inf | ||
| sky | -Inf | -Inf | -NaN |
| S/N | 31.8 | 52.8 | 56.9 |
| S/N(c) | 0.0 | 0.0 | 0.0 |
| SN(E/C) |
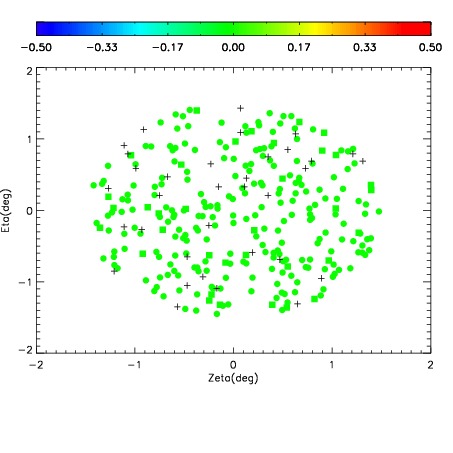
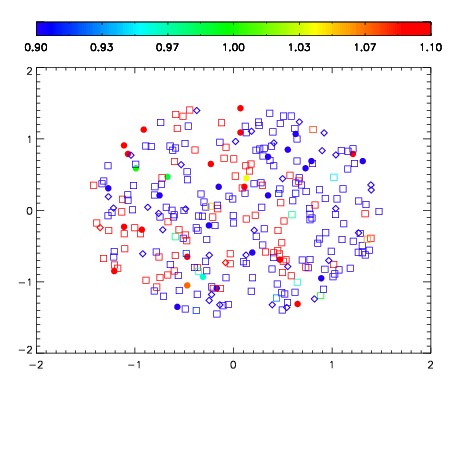
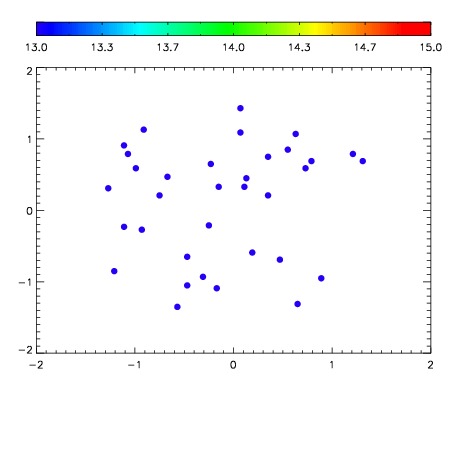

| Frame | Nreads | Zeropoints | Mag plots | Spatial mag deviation | Spatial sky 16325A emission deviations (filled: sky, open: star) | Spatial sky continuum emission | Spatial sky telluric CO2 absorption deviations (filled: H < 10) | |||||||||||||||||||||||
| 0 | 0 |
|
|
|
|
|
|
| IPAIR | NAME | SHIFT | NEWSHIFT | S/N | NAME | SHIFT | NEWSHIFT | S/N |
| 0 | 15610046 | 0.00173282 | 0.00000 | 19.0358 | 15610043 | -0.487519 | 0.489252 | 19.0398 |
| 1 | 15610049 | 0.000568808 | 0.00116401 | 19.0597 | 15610048 | -0.487278 | 0.489011 | 19.0541 |
| 2 | 15610050 | 0.00117939 | 0.000553430 | 19.0507 | 15610051 | -0.487860 | 0.489593 | 19.0478 |
| 3 | 15610042 | 0.00000 | 0.00173282 | 19.0429 | 15610047 | -0.486992 | 0.488725 | 19.0459 |
| 4 | 15610045 | 0.00156586 | 0.000166960 | 18.8603 | 15610044 | -0.487376 | 0.489109 | 18.9336 |