| Red | Green | Blue | |
| z | 17.64 | ||
| znorm | Inf | ||
| sky | -NaN | -NaN | -NaN |
| S/N | 28.1 | 49.5 | 51.0 |
| S/N(c) | 0.0 | 0.0 | 0.0 |
| SN(E/C) |
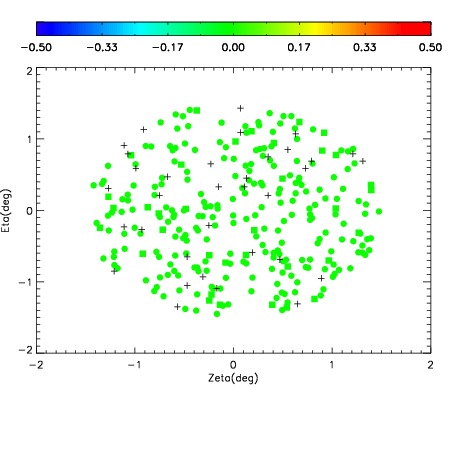
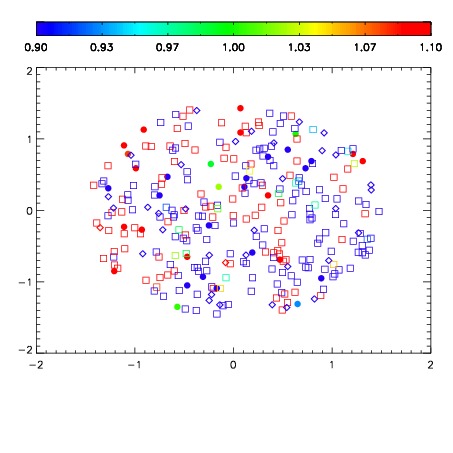
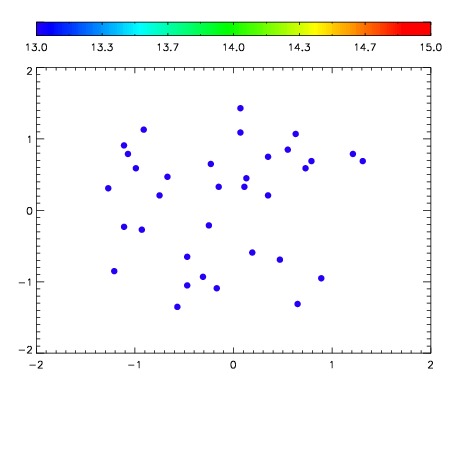

| Frame | Nreads | Zeropoints | Mag plots | Spatial mag deviation | Spatial sky 16325A emission deviations (filled: sky, open: star) | Spatial sky continuum emission | Spatial sky telluric CO2 absorption deviations (filled: H < 10) | |||||||||||||||||||||||
| 0 | 0 |
|
|
|
|
|
|
| IPAIR | NAME | SHIFT | NEWSHIFT | S/N | NAME | SHIFT | NEWSHIFT | S/N |
| 0 | 15910062 | 0.00286745 | 0.00000 | 18.9599 | 15910057 | -0.489442 | 0.492309 | 18.9218 |
| 1 | 15910055 | 0.00000 | 0.00286745 | 19.0404 | 15910060 | -0.488957 | 0.491824 | 18.9950 |
| 2 | 15910059 | 0.00181774 | 0.00104971 | 19.0259 | 15910061 | -0.488837 | 0.491704 | 18.9632 |
| 3 | 15910058 | 0.00104519 | 0.00182226 | 19.0176 | 15910056 | -0.489037 | 0.491904 | 18.9448 |