| Red | Green | Blue | |
| z | 17.64 | ||
| znorm | Inf | ||
| sky | -Inf | -Inf | -NaN |
| S/N | 19.9 | 38.4 | 44.0 |
| S/N(c) | 6.7 | 70.4 | 9.4 |
| SN(E/C) |
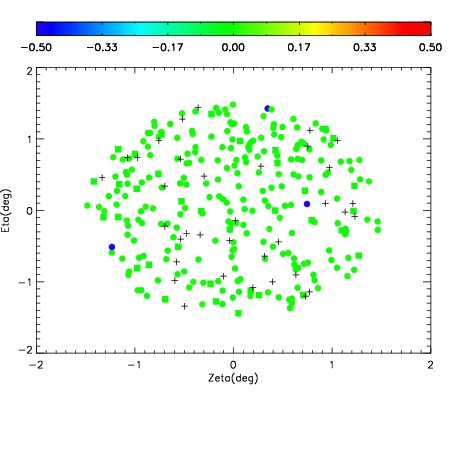

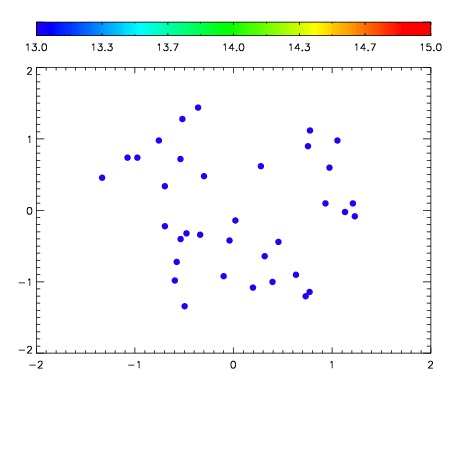

| Frame | Nreads | Zeropoints | Mag plots | Spatial mag deviation | Spatial sky 16325A emission deviations (filled: sky, open: star) | Spatial sky continuum emission | Spatial sky telluric CO2 absorption deviations (filled: H < 10) | |||||||||||||||||||||||
| 0 | 0 |
|
|
|
|
|
|
| IPAIR | NAME | SHIFT | NEWSHIFT | S/N | NAME | SHIFT | NEWSHIFT | S/N |
| 0 | 15600076 | 0.00562939 | 0.00000 | 18.8185 | 15600075 | -0.488055 | 0.493684 | 18.7666 |
| 1 | 15600069 | 0.00000 | 0.00562939 | 18.8707 | 15600071 | -0.489057 | 0.494686 | 18.8994 |
| 2 | 15600073 | 0.00262684 | 0.00300255 | 18.8422 | 15600070 | -0.489000 | 0.494629 | 18.8662 |
| 3 | 15600072 | 0.00222041 | 0.00340898 | 18.8328 | 15600074 | -0.488779 | 0.494408 | 18.8334 |