| Red | Green | Blue | |
| z | 17.64 | ||
| znorm | Inf | ||
| sky | -Inf | -NaN | -NaN |
| S/N | 23.0 | 42.5 | 49.2 |
| S/N(c) | 7.7 | 78.0 | 10.7 |
| SN(E/C) |
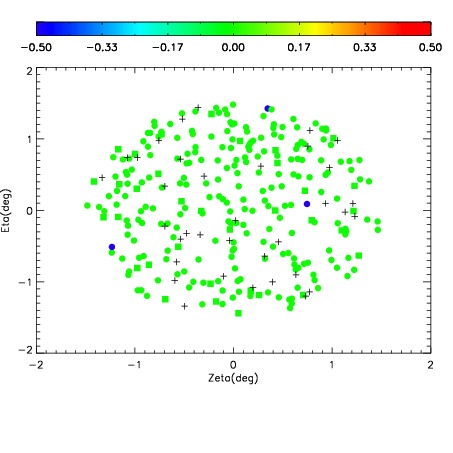
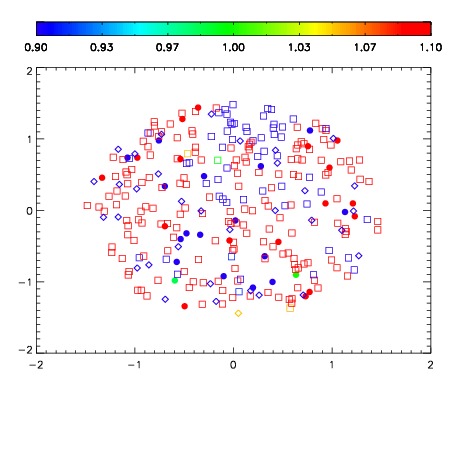
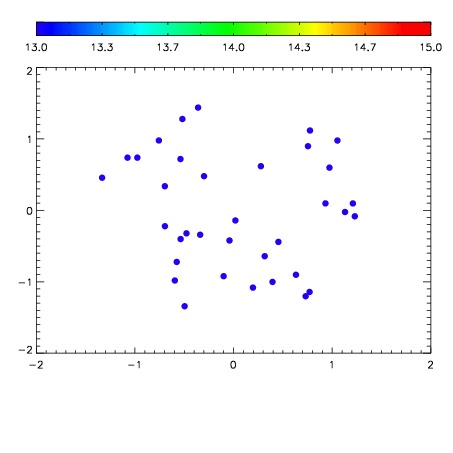

| Frame | Nreads | Zeropoints | Mag plots | Spatial mag deviation | Spatial sky 16325A emission deviations (filled: sky, open: star) | Spatial sky continuum emission | Spatial sky telluric CO2 absorption deviations (filled: H < 10) | |||||||||||||||||||||||
| 0 | 0 |
|
|
|
|
|
|
| IPAIR | NAME | SHIFT | NEWSHIFT | S/N | NAME | SHIFT | NEWSHIFT | S/N |
| 0 | 15610038 | 0.00302684 | 0.00000 | 19.0535 | 15610036 | -0.488534 | 0.491561 | 19.0558 |
| 1 | 15610035 | 0.00195898 | 0.00106786 | 19.0399 | 15610037 | -0.488120 | 0.491147 | 19.0389 |
| 2 | 15610034 | 0.00148779 | 0.00153905 | 19.0314 | 15610032 | -0.489249 | 0.492276 | 18.9929 |
| 3 | 15610031 | 0.00000 | 0.00302684 | 18.9445 | 15610033 | -0.489469 | 0.492496 | 18.9924 |