| Red | Green | Blue | |
| z | 17.65 | ||
| znorm | Inf | ||
| sky | -Inf | -Inf | -NaN |
| S/N | 19.0 | 37.9 | 40.0 |
| S/N(c) | 36.4 | 35.0 | 80.8 |
| SN(E/C) |
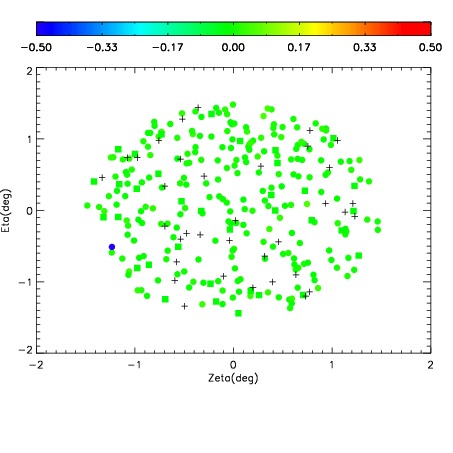
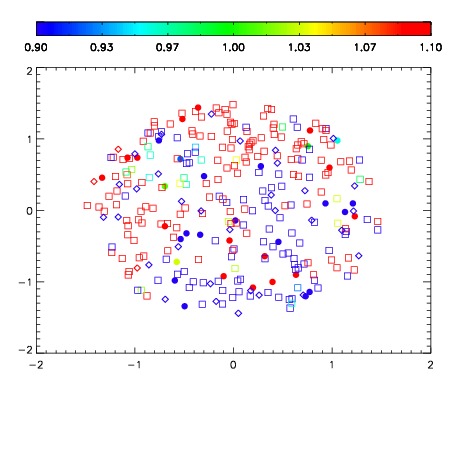
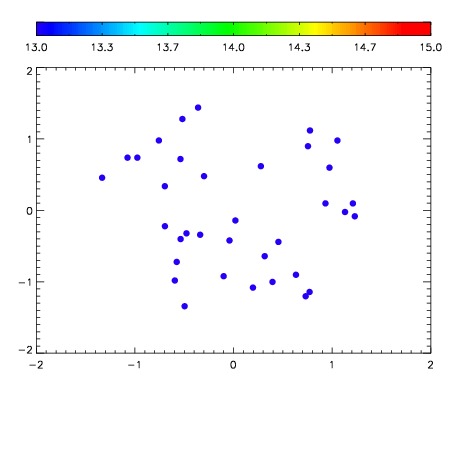

| Frame | Nreads | Zeropoints | Mag plots | Spatial mag deviation | Spatial sky 16325A emission deviations (filled: sky, open: star) | Spatial sky continuum emission | Spatial sky telluric CO2 absorption deviations (filled: H < 10) | |||||||||||||||||||||||
| 0 | 0 |
|
|
|
|
|
|
| IPAIR | NAME | SHIFT | NEWSHIFT | S/N | NAME | SHIFT | NEWSHIFT | S/N |
| 0 | 15900047 | 0.00141782 | 0.00000 | 18.6726 | 15900048 | -0.487735 | 0.489153 | 18.6942 |
| 1 | 15900043 | 0.00000 | 0.00141782 | 18.9515 | 15900045 | -0.489485 | 0.490903 | 18.8986 |
| 2 | 15900046 | 0.000847208 | 0.000570612 | 18.8320 | 15900044 | -0.489439 | 0.490857 | 18.8522 |
| 3 | 15900050 | 0.000777955 | 0.000639865 | 18.8209 | 15900049 | -0.487633 | 0.489051 | 18.7441 |