| Red | Green | Blue | |
| z | 17.63 | ||
| znorm | Inf | ||
| sky | -NaN | -NaN | -NaN |
| S/N | 21.6 | 40.7 | 45.1 |
| S/N(c) | 35.9 | 75.8 | 90.0 |
| SN(E/C) |
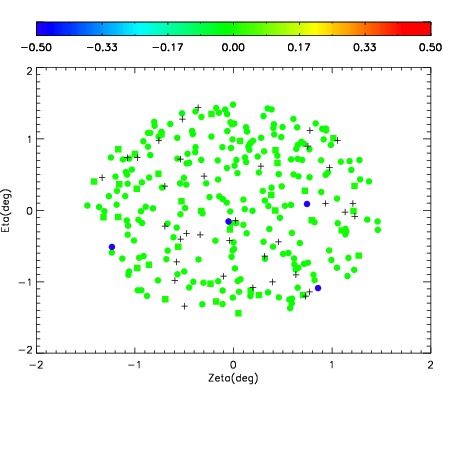
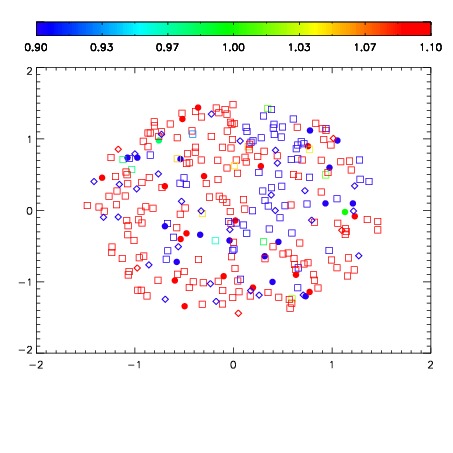
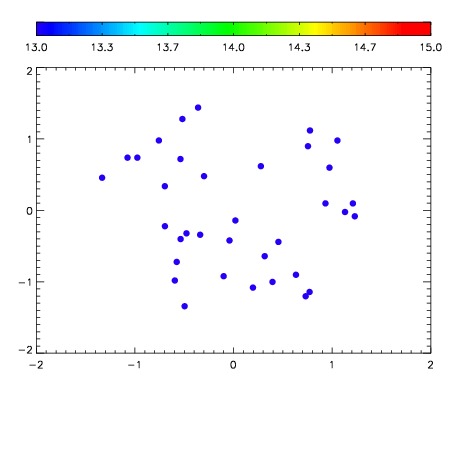

| Frame | Nreads | Zeropoints | Mag plots | Spatial mag deviation | Spatial sky 16325A emission deviations (filled: sky, open: star) | Spatial sky continuum emission | Spatial sky telluric CO2 absorption deviations (filled: H < 10) | |||||||||||||||||||||||
| 0 | 0 |
|
|
|
|
|
|
| IPAIR | NAME | SHIFT | NEWSHIFT | S/N | NAME | SHIFT | NEWSHIFT | S/N |
| 0 | 16060039 | 0.487950 | 0.00000 | 19.0074 | 16060040 | 0.00281079 | 0.485139 | 19.0005 |
| 1 | 16060034 | 0.486157 | 0.00179300 | 18.9471 | 16060037 | 0.00157320 | 0.486377 | 18.9836 |
| 2 | 16060038 | 0.487066 | 0.000883996 | 18.9411 | 16060036 | 0.00148317 | 0.486467 | 18.9239 |
| 3 | 16060035 | 0.487104 | 0.000845999 | 18.9178 | 16060033 | 0.00000 | 0.487950 | 18.8972 |