| Red | Green | Blue | |
| z | 17.65 | ||
| znorm | Inf | ||
| sky | -Inf | -NaN | -Inf |
| S/N | 11.5 | 22.5 | 25.0 |
| S/N(c) | 25.2 | 29.8 | 44.7 |
| SN(E/C) |
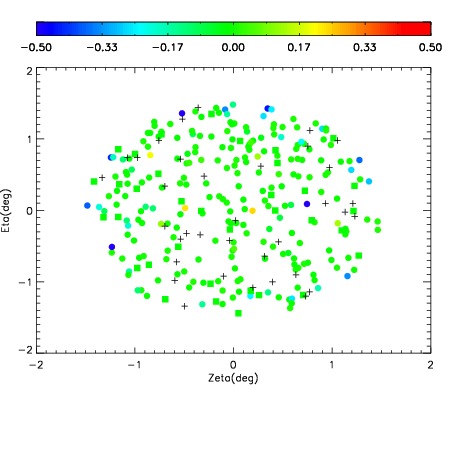
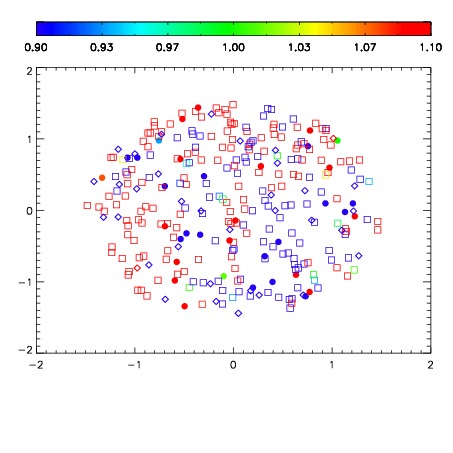
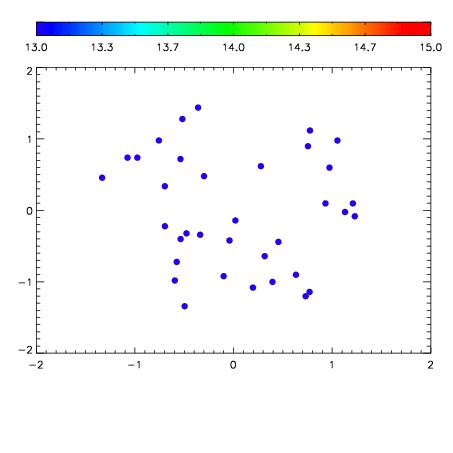

| Frame | Nreads | Zeropoints | Mag plots | Spatial mag deviation | Spatial sky 16325A emission deviations (filled: sky, open: star) | Spatial sky continuum emission | Spatial sky telluric CO2 absorption deviations (filled: H < 10) | |||||||||||||||||||||||
| 0 | 0 |
|
|
|
|
|
|
| IPAIR | NAME | SHIFT | NEWSHIFT | S/N | NAME | SHIFT | NEWSHIFT | S/N |
| 0 | 16130031 | 0.497594 | 0.00000 | 18.4867 | 16130032 | 0.00115606 | 0.496438 | 18.4238 |
| 1 | 16130030 | 0.497088 | 0.000506014 | 18.2517 | 16130029 | 0.00000 | 0.497594 | 18.3344 |