| Red | Green | Blue | |
| z | 17.64 | ||
| znorm | Inf | ||
| sky | -NaN | -NaN | -NaN |
| S/N | 30.0 | 44.9 | 53.6 |
| S/N(c) | 58.7 | 69.4 | 11.2 |
| SN(E/C) |
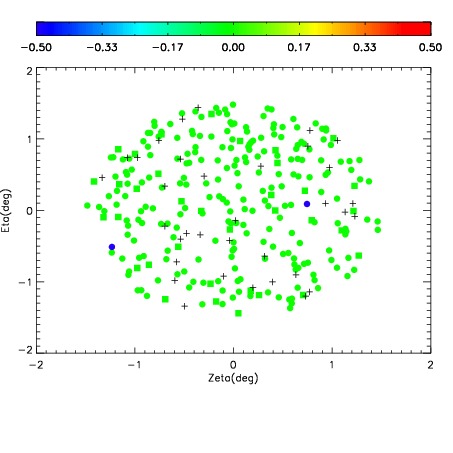
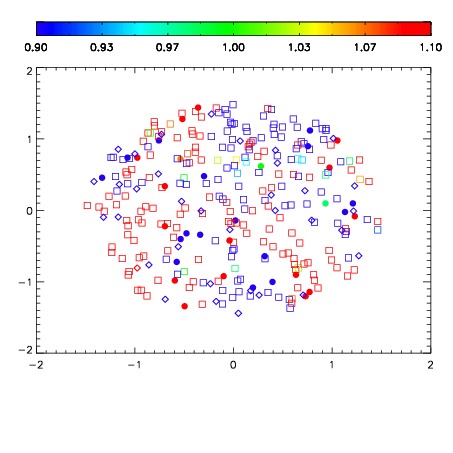
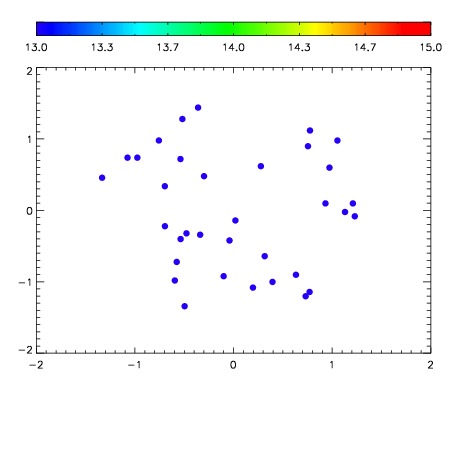

| Frame | Nreads | Zeropoints | Mag plots | Spatial mag deviation | Spatial sky 16325A emission deviations (filled: sky, open: star) | Spatial sky continuum emission | Spatial sky telluric CO2 absorption deviations (filled: H < 10) | |||||||||||||||||||||||
| 0 | 0 |
|
|
|
|
|
|
| IPAIR | NAME | SHIFT | NEWSHIFT | S/N | NAME | SHIFT | NEWSHIFT | S/N |
| 0 | 18860092 | 0.000859181 | 0.00000 | 19.7186 | 18860090 | -0.510349 | 0.511208 | 19.7474 |
| 1 | 18860089 | 0.00000 | 0.000859181 | 19.6730 | 18860091 | -0.510613 | 0.511472 | 19.7299 |