| Red | Green | Blue | |
| z | 17.64 | ||
| znorm | Inf | ||
| sky | -Inf | -Inf | -NaN |
| S/N | 29.8 | 53.3 | 57.7 |
| S/N(c) | 0.0 | 0.0 | 0.0 |
| SN(E/C) |
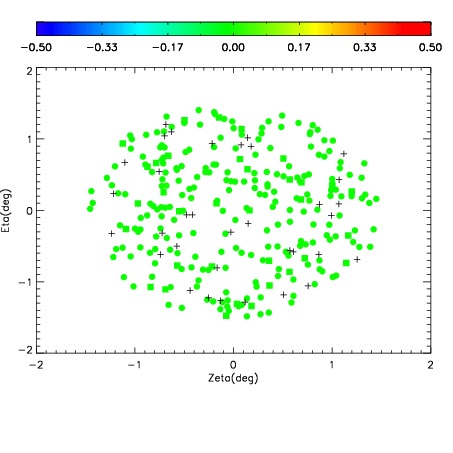
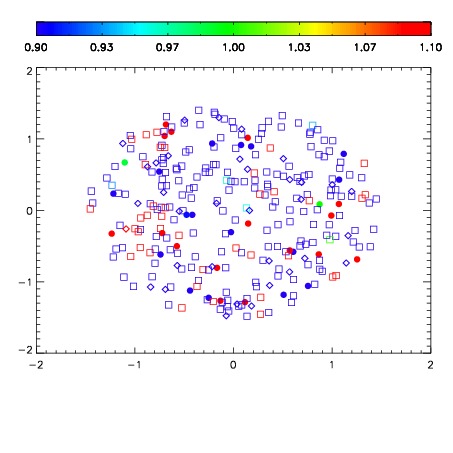
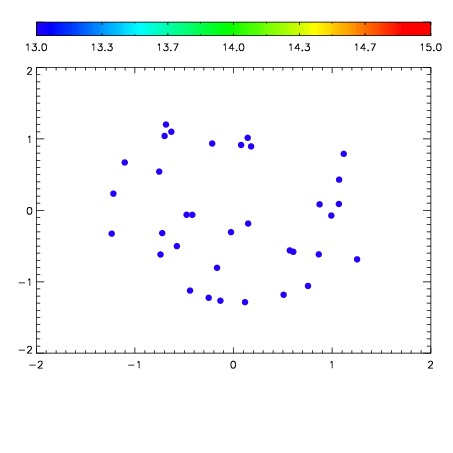

| Frame | Nreads | Zeropoints | Mag plots | Spatial mag deviation | Spatial sky 16325A emission deviations (filled: sky, open: star) | Spatial sky continuum emission | Spatial sky telluric CO2 absorption deviations (filled: H < 10) | |||||||||||||||||||||||
| 0 | 0 |
|
|
|
|
|
|
| IPAIR | NAME | SHIFT | NEWSHIFT | S/N | NAME | SHIFT | NEWSHIFT | S/N |
| 0 | 15690039 | 0.493276 | 0.00000 | 18.4692 | 15690040 | 0.00354668 | 0.489729 | 18.5393 |
| 1 | 15690030 | 0.489297 | 0.00397900 | 18.6770 | 15690029 | -8.19857e-05 | 0.493358 | 18.6634 |
| 2 | 15690035 | 0.492556 | 0.000719994 | 18.6280 | 15690036 | 0.00280488 | 0.490471 | 18.6240 |
| 3 | 15690042 | 0.491076 | 0.00220001 | 18.4887 | 15690041 | 0.00287103 | 0.490405 | 18.5451 |
| 4 | 15690034 | 0.492622 | 0.000654012 | 18.3052 | 15690033 | 0.00255828 | 0.490718 | 18.2443 |
| 5 | 15690038 | 0.492495 | 0.000781000 | 18.1364 | 15690037 | 0.00313179 | 0.490144 | 18.1120 |
| 6 | 15690027 | 0.491822 | 0.00145400 | 18.1011 | 15690028 | 0.00239089 | 0.490885 | 18.0682 |
| 7 | 15690031 | 0.490854 | 0.00242200 | 17.8630 | 15690032 | 0.00239829 | 0.490878 | 17.8858 |
| 8 | 15690026 | 0.490646 | 0.00263000 | 17.5668 | 15690025 | 0.00000 | 0.493276 | 17.5751 |