| Red | Green | Blue | |
| z | 17.64 | ||
| znorm | Inf | ||
| sky | -Inf | -Inf | -NaN |
| S/N | 15.3 | 27.3 | 30.2 |
| S/N(c) | 0.0 | 0.0 | 0.0 |
| SN(E/C) |
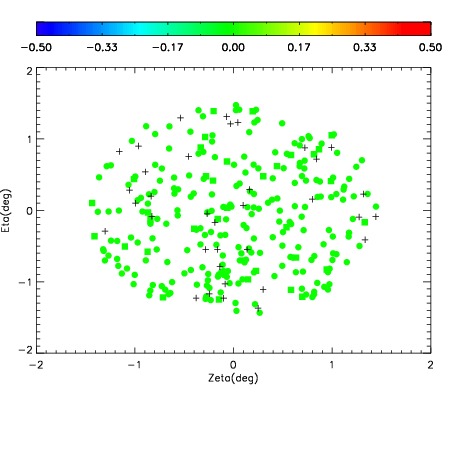
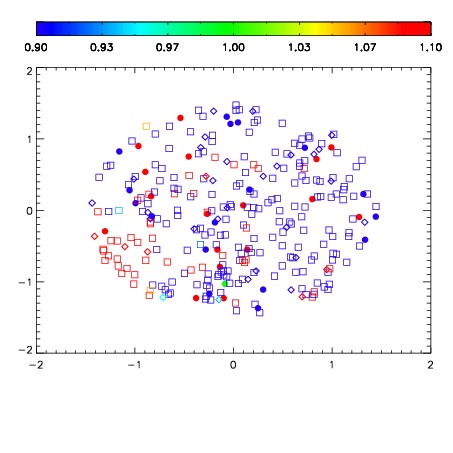
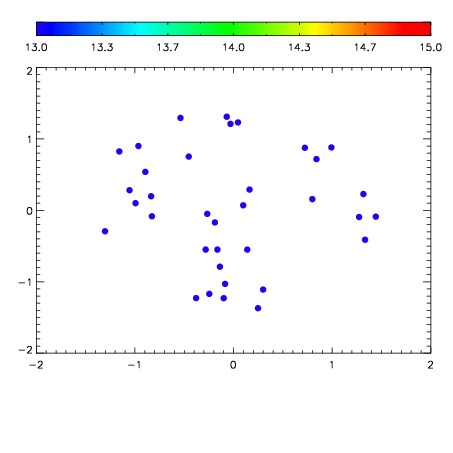

| Frame | Nreads | Zeropoints | Mag plots | Spatial mag deviation | Spatial sky 16325A emission deviations (filled: sky, open: star) | Spatial sky continuum emission | Spatial sky telluric CO2 absorption deviations (filled: H < 10) | |||||||||||||||||||||||
| 0 | 0 |
|
|
|
|
|
|
| IPAIR | NAME | SHIFT | NEWSHIFT | S/N | NAME | SHIFT | NEWSHIFT | S/N |
| 0 | 15970038 | 0.00246731 | 0.00000 | 14.8135 | 15970032 | -0.488929 | 0.491396 | 16.5251 |
| 1 | 15970026 | 0.00000 | 0.00246731 | 18.3372 | 15970027 | -0.487556 | 0.490023 | 18.3572 |
| 2 | 15970033 | 0.000734926 | 0.00173238 | 18.0178 | 15970028 | -0.487412 | 0.489879 | 18.1153 |
| 3 | 15970029 | 0.00136200 | 0.00110531 | 17.7624 | 15970036 | -0.489003 | 0.491470 | 16.8117 |
| 4 | 15970034 | 0.00110283 | 0.00136448 | 17.6657 | 15970031 | -0.488512 | 0.490979 | 16.6845 |
| 5 | 15970030 | 0.00197469 | 0.000492620 | 16.2879 | 15970039 | -0.485580 | 0.488047 | 16.5501 |