| Red | Green | Blue | |
| z | 17.64 | ||
| znorm | Inf | ||
| sky | -Inf | -Inf | -NaN |
| S/N | 20.7 | 33.9 | 39.0 |
| S/N(c) | 0.0 | 0.0 | 0.0 |
| SN(E/C) |
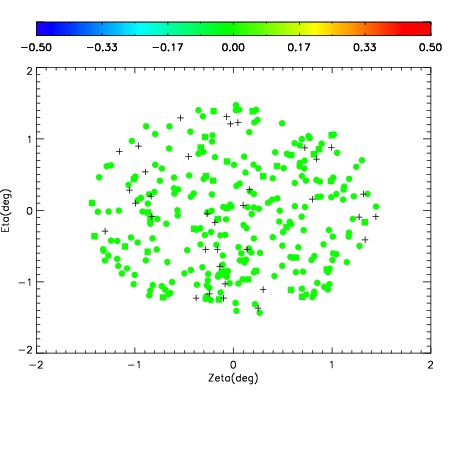
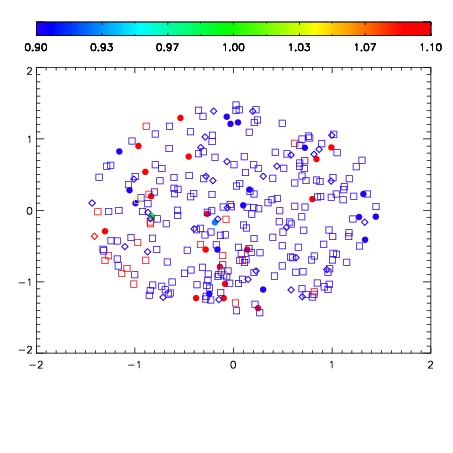
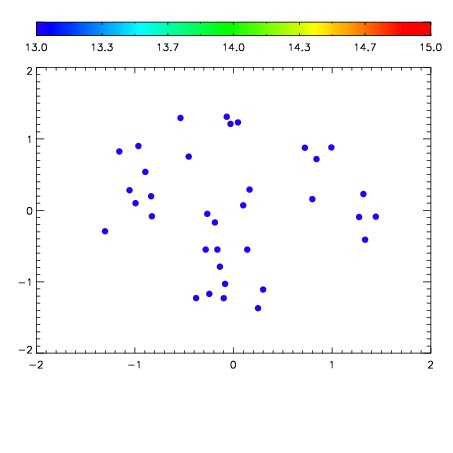

| Frame | Nreads | Zeropoints | Mag plots | Spatial mag deviation | Spatial sky 16325A emission deviations (filled: sky, open: star) | Spatial sky continuum emission | Spatial sky telluric CO2 absorption deviations (filled: H < 10) | |||||||||||||||||||||||
| 0 | 0 |
|
|
|
|
|
|
| IPAIR | NAME | SHIFT | NEWSHIFT | S/N | NAME | SHIFT | NEWSHIFT | S/N |
| 0 | 15980035 | 0.489702 | 0.00000 | 18.6264 | 15980033 | 0.00113790 | 0.488564 | 18.5440 |
| 1 | 15980032 | 0.488368 | 0.00133398 | 18.6037 | 15980034 | 0.000822490 | 0.488880 | 18.5241 |
| 2 | 15980031 | 0.488239 | 0.00146300 | 18.4535 | 15980030 | 0.00000 | 0.489702 | 18.3862 |