| Red | Green | Blue | |
| z | 17.64 | ||
| znorm | Inf | ||
| sky | -Inf | -Inf | -Inf |
| S/N | 21.8 | 37.4 | 44.0 |
| S/N(c) | 0.0 | 0.0 | 0.0 |
| SN(E/C) |
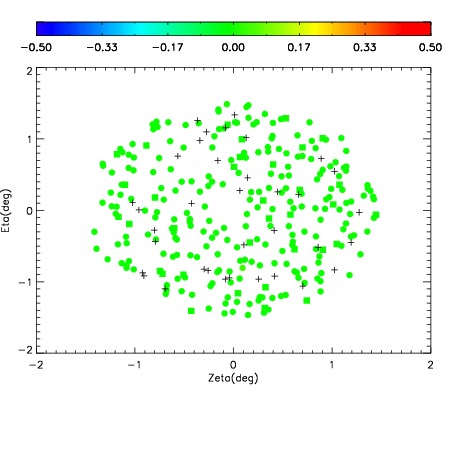
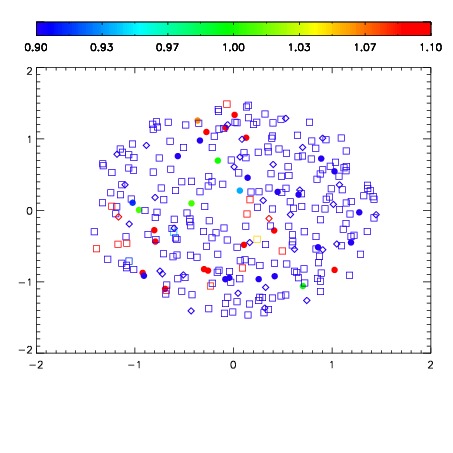


| Frame | Nreads | Zeropoints | Mag plots | Spatial mag deviation | Spatial sky 16325A emission deviations (filled: sky, open: star) | Spatial sky continuum emission | Spatial sky telluric CO2 absorption deviations (filled: H < 10) | |||||||||||||||||||||||
| 0 | 0 |
|
|
|
|
|
|
| IPAIR | NAME | SHIFT | NEWSHIFT | S/N | NAME | SHIFT | NEWSHIFT | S/N |
| 0 | 15470088 | 0.00112386 | 0.00000 | 18.2997 | 15470089 | -0.492355 | 0.493479 | 18.3741 |
| 1 | 15470087 | -0.000680143 | 0.00180400 | 18.6480 | 15470086 | -0.491310 | 0.492434 | 18.6072 |
| 2 | 15470080 | 0.00000 | 0.00112386 | 18.6075 | 15470081 | -0.491843 | 0.492967 | 18.5785 |
| 3 | 15470084 | 0.000877892 | 0.000245968 | 18.4874 | 15470085 | -0.491385 | 0.492509 | 18.4925 |
| 4 | 15470083 | 0.000349564 | 0.000774296 | 18.3204 | 15470090 | -0.492078 | 0.493202 | 18.3784 |
| 5 | 15470091 | -0.00112463 | 0.00224849 | 18.2590 | 15470082 | -0.492157 | 0.493281 | 18.2882 |