| Red | Green | Blue | |
| z | 17.64 | ||
| znorm | Inf | ||
| sky | -Inf | -Inf | -Inf |
| S/N | 14.4 | 24.2 | 28.7 |
| S/N(c) | 0.0 | 0.0 | 0.0 |
| SN(E/C) |
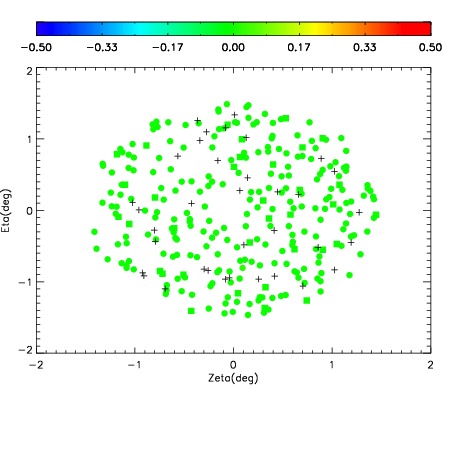
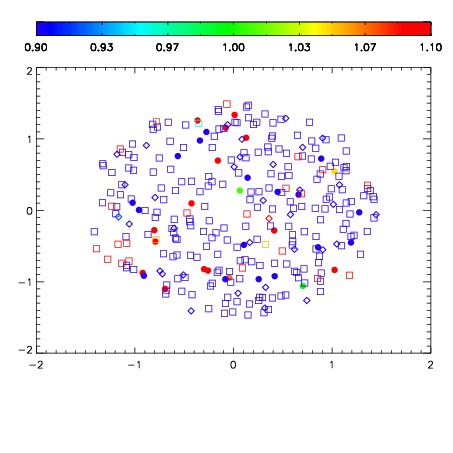


| Frame | Nreads | Zeropoints | Mag plots | Spatial mag deviation | Spatial sky 16325A emission deviations (filled: sky, open: star) | Spatial sky continuum emission | Spatial sky telluric CO2 absorption deviations (filled: H < 10) | |||||||||||||||||||||||
| 0 | 0 |
|
|
|
|
|
|
| IPAIR | NAME | SHIFT | NEWSHIFT | S/N | NAME | SHIFT | NEWSHIFT | S/N |
| 0 | 15480072 | 0.493385 | 0.00000 | 18.1199 | 15480073 | 0.000750446 | 0.492635 | 18.1819 |
| 1 | 15480075 | 0.492620 | 0.000764996 | 18.5545 | 15480074 | -2.22108e-05 | 0.493407 | 18.5790 |
| 2 | 15480071 | 0.492641 | 0.000743985 | 18.2252 | 15480070 | 0.00000 | 0.493385 | 18.3034 |