| Red | Green | Blue | |
| z | 17.64 | ||
| znorm | Inf | ||
| sky | -Inf | -Inf | -Inf |
| S/N | 12.3 | 26.0 | 25.7 |
| S/N(c) | 0.0 | 0.0 | 0.0 |
| SN(E/C) |
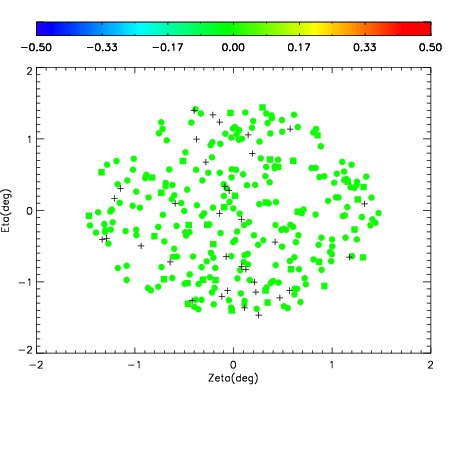
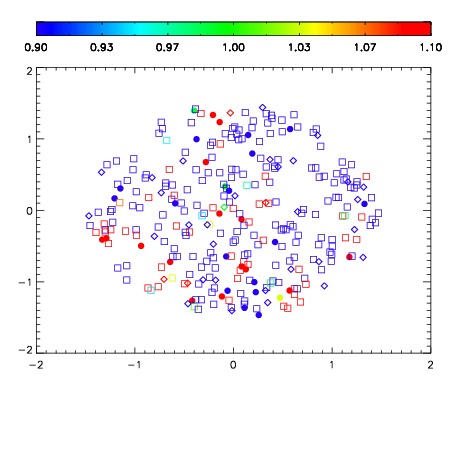
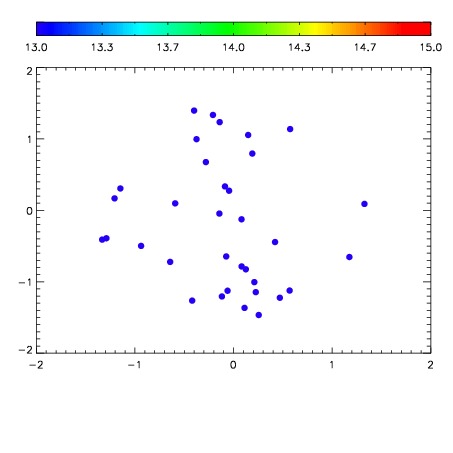

| Frame | Nreads | Zeropoints | Mag plots | Spatial mag deviation | Spatial sky 16325A emission deviations (filled: sky, open: star) | Spatial sky continuum emission | Spatial sky telluric CO2 absorption deviations (filled: H < 10) | |||||||||||||||||||||||
| 0 | 0 |
|
|
|
|
|
|
| IPAIR | NAME | SHIFT | NEWSHIFT | S/N | NAME | SHIFT | NEWSHIFT | S/N |
| 0 | 15730093 | 0.00129627 | 0.00000 | 17.9721 | 15730094 | -0.486761 | 0.488057 | 17.9710 |
| 1 | 15730089 | -0.000363439 | 0.00165971 | 18.3220 | 15730095 | -0.485544 | 0.486840 | 18.2962 |
| 2 | 15730092 | 0.000775680 | 0.000520590 | 18.3095 | 15730090 | -0.485807 | 0.487103 | 18.2567 |
| 3 | 15730096 | -0.000603120 | 0.00189939 | 18.1038 | 15730091 | -0.485889 | 0.487185 | 18.1257 |
| 4 | 15730088 | 0.000131194 | 0.00116508 | 18.0467 | 15730086 | -0.487177 | 0.488473 | 18.0770 |
| 5 | 15730085 | 0.00000 | 0.00129627 | 18.0314 | 15730087 | -0.487073 | 0.488369 | 18.0437 |
| 6 | 15730097 | 0.00105996 | 0.000236310 | 17.6926 | 15730098 | -0.484500 | 0.485796 | 17.8897 |