| Red | Green | Blue | |
| z | 17.64 | ||
| znorm | Inf | ||
| sky | -Inf | -Inf | -Inf |
| S/N | 23.0 | 42.1 | 46.3 |
| S/N(c) | 0.0 | 0.0 | 0.0 |
| SN(E/C) |
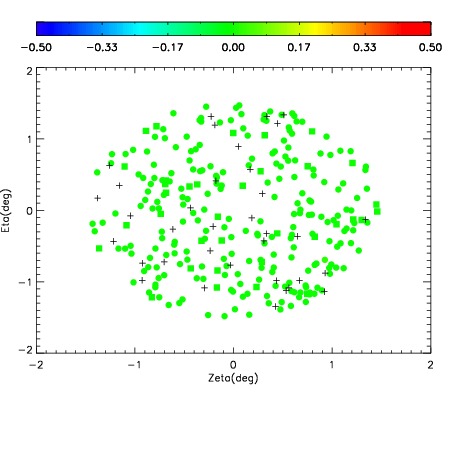
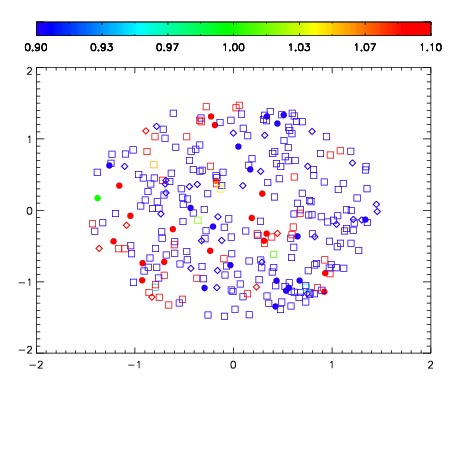
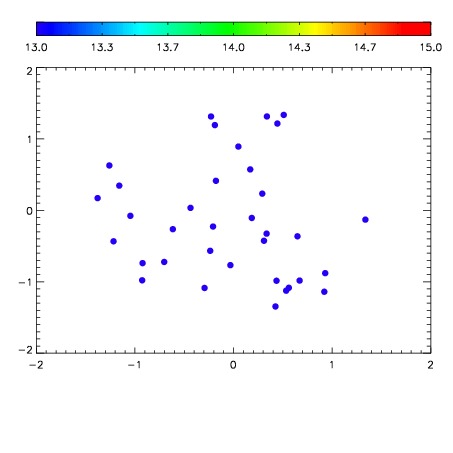

| Frame | Nreads | Zeropoints | Mag plots | Spatial mag deviation | Spatial sky 16325A emission deviations (filled: sky, open: star) | Spatial sky continuum emission | Spatial sky telluric CO2 absorption deviations (filled: H < 10) | |||||||||||||||||||||||
| 0 | 0 |
|
|
|
|
|
|
| IPAIR | NAME | SHIFT | NEWSHIFT | S/N | NAME | SHIFT | NEWSHIFT | S/N |
| 0 | 15790075 | 0.483783 | 0.00000 | 18.6199 | 15790076 | 0.00234914 | 0.481434 | 18.6506 |
| 1 | 15790074 | 0.482473 | 0.00131002 | 18.5163 | 15790073 | 0.000973807 | 0.482809 | 18.4612 |
| 2 | 15790070 | 0.482263 | 0.00152001 | 18.4691 | 15790069 | 0.00000 | 0.483783 | 18.4524 |
| 3 | 15790071 | 0.482544 | 0.00123900 | 18.1457 | 15790072 | 0.00131431 | 0.482469 | 18.0583 |
| 4 | 15790078 | 0.483717 | 6.60121e-05 | 17.8307 | 15790077 | 0.00213603 | 0.481647 | 17.8912 |