| Red | Green | Blue | |
| z | 17.64 | ||
| znorm | Inf | ||
| sky | -Inf | -Inf | -Inf |
| S/N | 18.2 | 33.0 | 36.9 |
| S/N(c) | 0.0 | 0.0 | 0.0 |
| SN(E/C) |
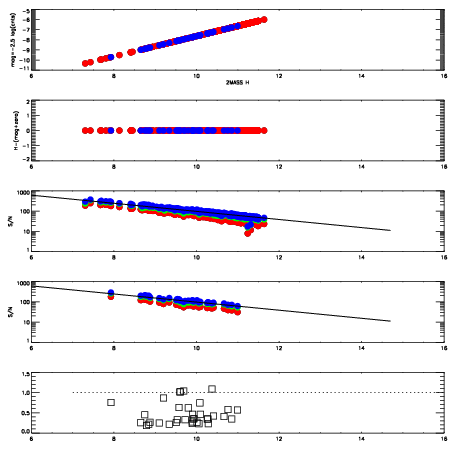
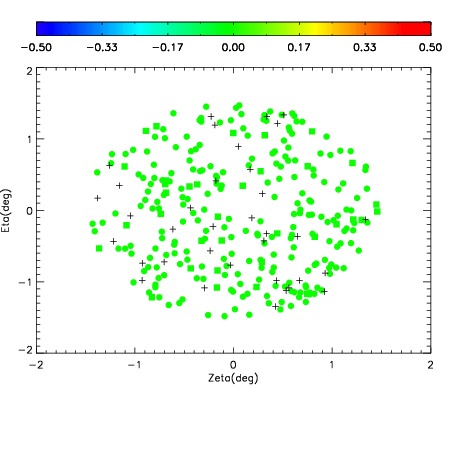
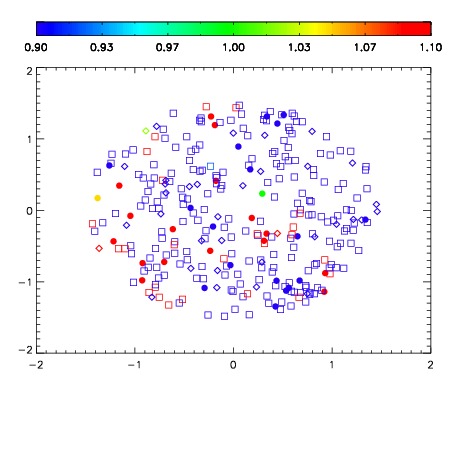
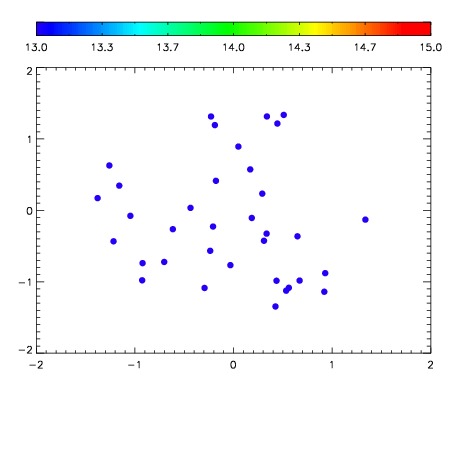

| Frame | Nreads | Zeropoints | Mag plots | Spatial mag deviation | Spatial sky 16325A emission deviations (filled: sky, open: star) | Spatial sky continuum emission | Spatial sky telluric CO2 absorption deviations (filled: H < 10) | |||||||||||||||||||||||
| 0 | 0 |
|
|
|
|
|
|
| IPAIR | NAME | SHIFT | NEWSHIFT | S/N | NAME | SHIFT | NEWSHIFT | S/N |
| 0 | 15910048 | 0.490850 | 0.00000 | 18.2643 | 15910049 | 0.000730650 | 0.490119 | 18.3808 |
| 1 | 15910051 | 0.489630 | 0.00121999 | 18.5711 | 15910050 | 0.000619233 | 0.490231 | 18.6463 |
| 2 | 15910047 | 0.490173 | 0.000676990 | 18.2522 | 15910046 | 0.00000 | 0.490850 | 18.2480 |