| Red | Green | Blue | |
| z | 17.64 | ||
| znorm | Inf | ||
| sky | -Inf | -Inf | -NaN |
| S/N | 25.4 | 46.8 | 49.1 |
| S/N(c) | 0.0 | 0.0 | 0.0 |
| SN(E/C) |
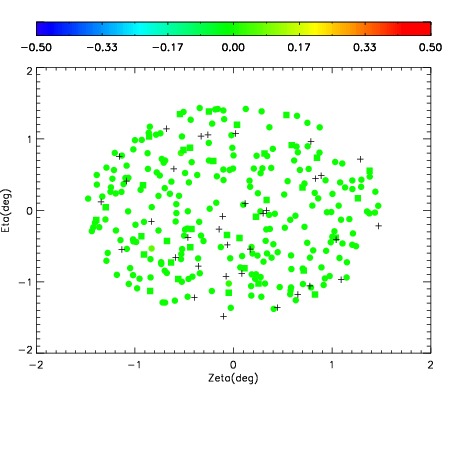
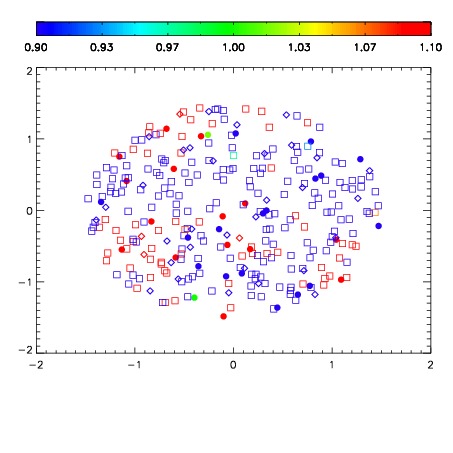
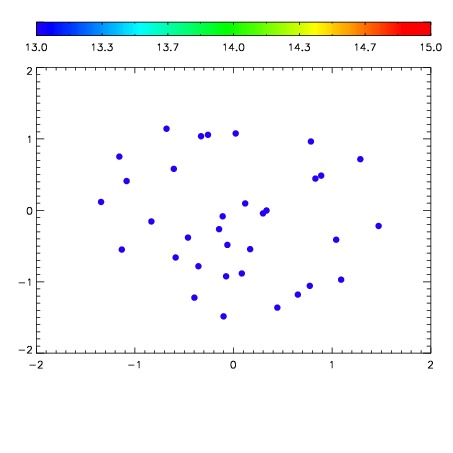

| Frame | Nreads | Zeropoints | Mag plots | Spatial mag deviation | Spatial sky 16325A emission deviations (filled: sky, open: star) | Spatial sky continuum emission | Spatial sky telluric CO2 absorption deviations (filled: H < 10) | |||||||||||||||||||||||
| 0 | 0 |
|
|
|
|
|
|
| IPAIR | NAME | SHIFT | NEWSHIFT | S/N | NAME | SHIFT | NEWSHIFT | S/N |
| 0 | 19000046 | 0.000751471 | 0.00000 | 18.0211 | 19000060 | -0.502373 | 0.503124 | 18.0580 |
| 1 | 19000050 | -0.000631998 | 0.00138347 | 18.5162 | 19000049 | -0.502814 | 0.503565 | 18.5619 |
| 2 | 19000055 | -0.00133447 | 0.00208594 | 18.4947 | 19000048 | -0.501736 | 0.502487 | 18.4738 |
| 3 | 19000047 | 0.000615141 | 0.000136330 | 18.4884 | 19000056 | -0.501823 | 0.502575 | 18.4615 |
| 4 | 19000058 | -0.000769937 | 0.00152141 | 18.2635 | 19000044 | -0.500752 | 0.501503 | 18.2891 |
| 5 | 19000054 | -0.00232218 | 0.00307365 | 18.2590 | 19000053 | -0.502996 | 0.503748 | 18.2490 |
| 6 | 19000043 | 0.00000 | 0.000751471 | 18.2323 | 19000057 | -0.502018 | 0.502769 | 18.2152 |
| 7 | 19000051 | -0.000101135 | 0.000852606 | 18.1515 | 19000045 | -0.499699 | 0.500450 | 18.1336 |
| 8 | 19000059 | -0.000381308 | 0.00113278 | 18.0005 | 19000052 | -0.502705 | 0.503456 | 18.0443 |