| Red | Green | Blue | |
| z | 17.64 | ||
| znorm | Inf | ||
| sky | -Inf | -Inf | -NaN |
| S/N | 11.2 | 21.9 | 22.4 |
| S/N(c) | 0.0 | 0.0 | 0.0 |
| SN(E/C) |
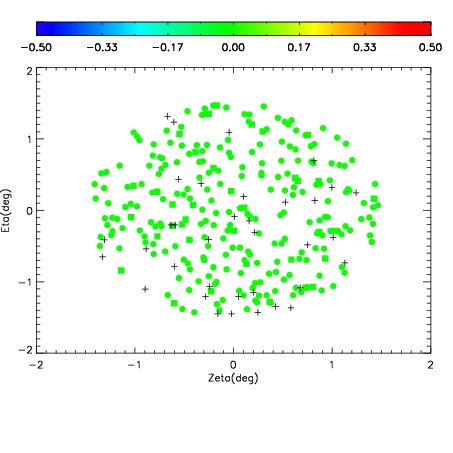
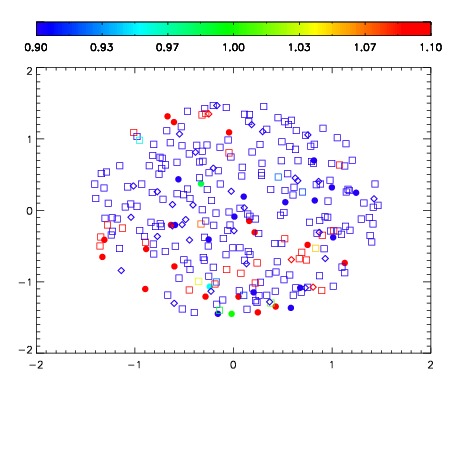
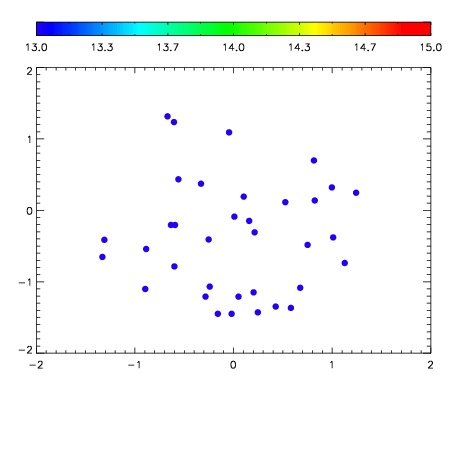

| Frame | Nreads | Zeropoints | Mag plots | Spatial mag deviation | Spatial sky 16325A emission deviations (filled: sky, open: star) | Spatial sky continuum emission | Spatial sky telluric CO2 absorption deviations (filled: H < 10) | |||||||||||||||||||||||
| 0 | 0 |
|
|
|
|
|
|
| IPAIR | NAME | SHIFT | NEWSHIFT | S/N | NAME | SHIFT | NEWSHIFT | S/N |
| 0 | 15650075 | 0.000575991 | 0.00000 | 17.4999 | 15650076 | -0.486393 | 0.486969 | 16.8985 |
| 1 | 15650074 | -0.00109435 | 0.00167034 | 18.6740 | 15650073 | -0.485054 | 0.485630 | 18.7182 |
| 2 | 15650071 | 0.00000 | 0.000575991 | 18.2596 | 15650072 | -0.484934 | 0.485510 | 18.3983 |