| Red | Green | Blue | |
| z | 17.64 | ||
| znorm | Inf | ||
| sky | -Inf | -Inf | -Inf |
| S/N | 12.8 | 24.3 | 24.3 |
| S/N(c) | 0.0 | 0.0 | 0.0 |
| SN(E/C) |
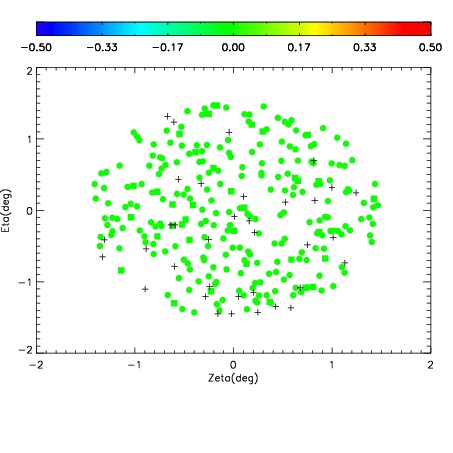
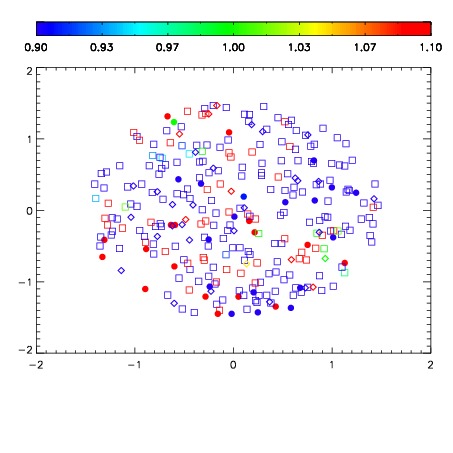
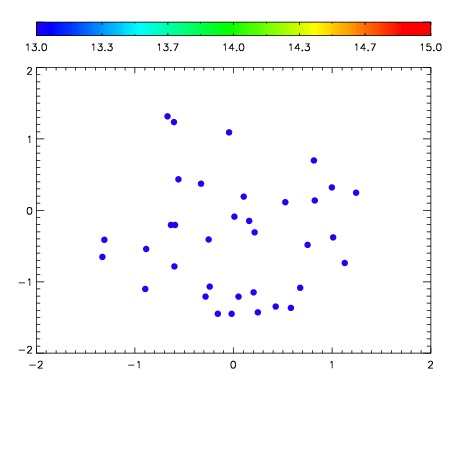

| Frame | Nreads | Zeropoints | Mag plots | Spatial mag deviation | Spatial sky 16325A emission deviations (filled: sky, open: star) | Spatial sky continuum emission | Spatial sky telluric CO2 absorption deviations (filled: H < 10) | |||||||||||||||||||||||
| 0 | 0 |
|
|
|
|
|
|
| IPAIR | NAME | SHIFT | NEWSHIFT | S/N | NAME | SHIFT | NEWSHIFT | S/N |
| 0 | 15670060 | 0.00150215 | 0.00000 | 18.0766 | 15670061 | -0.487889 | 0.489391 | 18.0267 |
| 1 | 15670059 | 0.000935164 | 0.000566986 | 18.2997 | 15670058 | -0.488130 | 0.489632 | 18.3093 |
| 2 | 15670056 | 0.00000 | 0.00150215 | 18.2324 | 15670057 | -0.487686 | 0.489188 | 18.2588 |