| Red | Green | Blue | |
| z | 17.64 | ||
| znorm | Inf | ||
| sky | -Inf | -NaN | -NaN |
| S/N | 16.0 | 29.2 | 30.9 |
| S/N(c) | 0.0 | 0.0 | 0.0 |
| SN(E/C) |
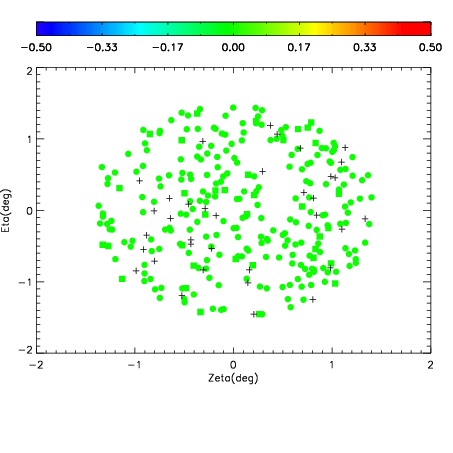
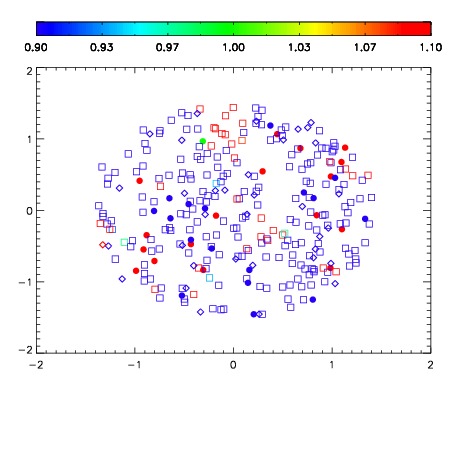
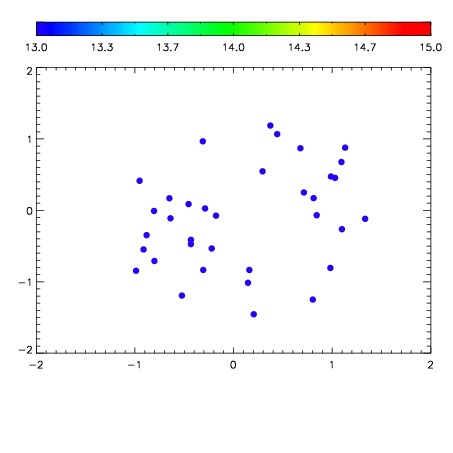

| Frame | Nreads | Zeropoints | Mag plots | Spatial mag deviation | Spatial sky 16325A emission deviations (filled: sky, open: star) | Spatial sky continuum emission | Spatial sky telluric CO2 absorption deviations (filled: H < 10) | |||||||||||||||||||||||
| 0 | 0 |
|
|
|
|
|
|
| IPAIR | NAME | SHIFT | NEWSHIFT | S/N | NAME | SHIFT | NEWSHIFT | S/N |
| 0 | 15650085 | 0.491562 | 0.00000 | 14.3707 | 15650083 | 0.00139728 | 0.490165 | 18.3503 |
| 1 | 15650081 | 0.485529 | 0.00603300 | 18.5900 | 15650080 | 0.00000 | 0.491562 | 18.5621 |
| 2 | 15650082 | 0.487701 | 0.00386101 | 18.3332 | 15650084 | 0.000347807 | 0.491214 | 18.4012 |