| Red | Green | Blue | |
| z | 17.64 | ||
| znorm | Inf | ||
| sky | -NaN | -Inf | -Inf |
| S/N | 28.3 | 47.5 | 54.5 |
| S/N(c) | 0.0 | 0.0 | 0.0 |
| SN(E/C) |
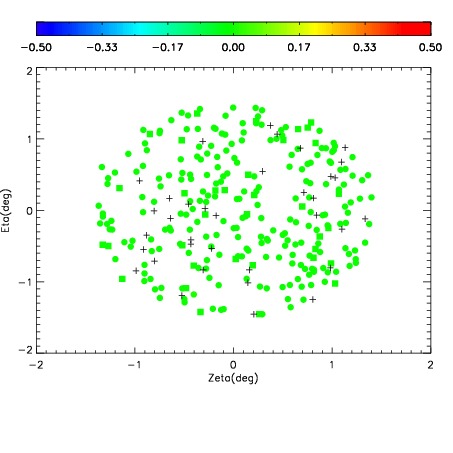
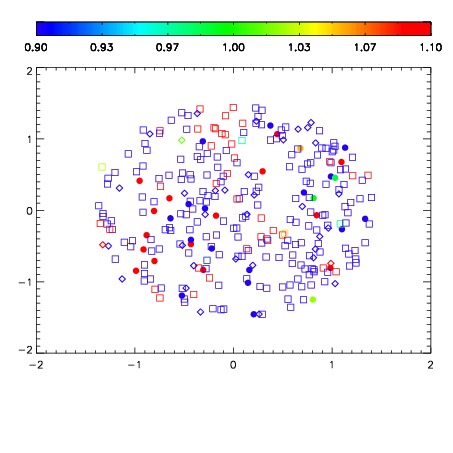
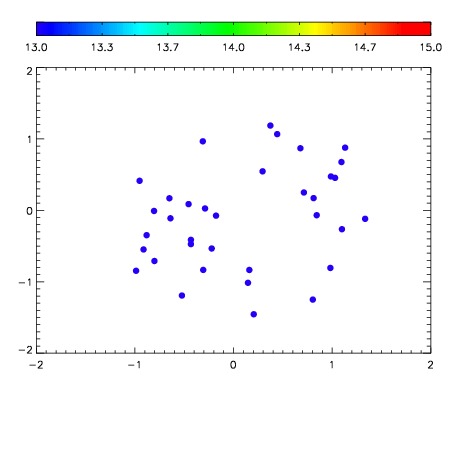

| Frame | Nreads | Zeropoints | Mag plots | Spatial mag deviation | Spatial sky 16325A emission deviations (filled: sky, open: star) | Spatial sky continuum emission | Spatial sky telluric CO2 absorption deviations (filled: H < 10) | |||||||||||||||||||||||
| 0 | 0 |
|
|
|
|
|
|
| IPAIR | NAME | SHIFT | NEWSHIFT | S/N | NAME | SHIFT | NEWSHIFT | S/N |
| 0 | 15680061 | 0.00392055 | 0.00000 | 18.2877 | 15680062 | -0.489477 | 0.493398 | 18.3298 |
| 1 | 15680060 | 0.00218368 | 0.00173687 | 18.6014 | 15680059 | -0.489523 | 0.493444 | 18.5423 |
| 2 | 15680057 | 0.00303538 | 0.000885170 | 18.5054 | 15680058 | -0.489155 | 0.493076 | 18.4942 |
| 3 | 15680053 | 0.00000 | 0.00392055 | 18.4623 | 15680054 | -0.489393 | 0.493314 | 18.4851 |
| 4 | 15680065 | 0.00312303 | 0.000797520 | 18.3962 | 15680066 | -0.489993 | 0.493914 | 18.3711 |
| 5 | 15680064 | 0.00209660 | 0.00182395 | 18.3287 | 15680063 | -0.489697 | 0.493618 | 18.3305 |
| 6 | 15680056 | 0.00247178 | 0.00144877 | 18.2502 | 15680055 | -0.489541 | 0.493462 | 18.1707 |