| Red | Green | Blue | |
| z | 17.64 | ||
| znorm | Inf | ||
| sky | -Inf | -Inf | -Inf |
| S/N | 20.6 | 38.8 | 40.1 |
| S/N(c) | 0.0 | 0.0 | 0.0 |
| SN(E/C) |
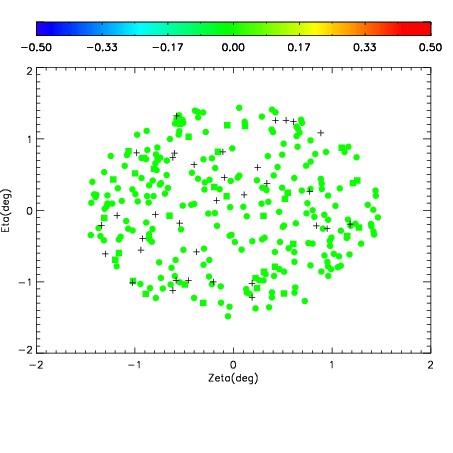
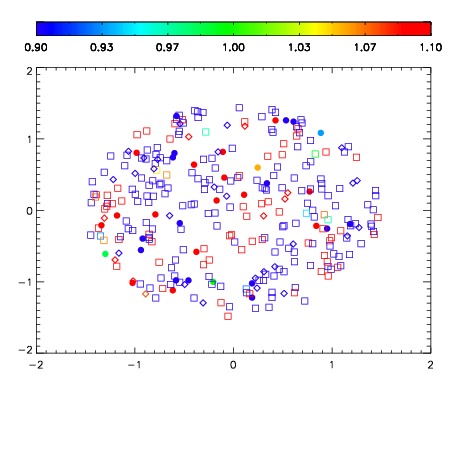
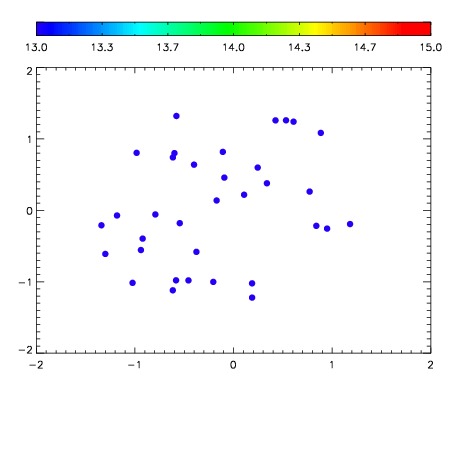

| Frame | Nreads | Zeropoints | Mag plots | Spatial mag deviation | Spatial sky 16325A emission deviations (filled: sky, open: star) | Spatial sky continuum emission | Spatial sky telluric CO2 absorption deviations (filled: H < 10) | |||||||||||||||||||||||
| 0 | 0 |
|
|
|
|
|
|
| IPAIR | NAME | SHIFT | NEWSHIFT | S/N | NAME | SHIFT | NEWSHIFT | S/N |
| 0 | 16000053 | 0.00156578 | 0.00000 | 18.1764 | 16000054 | -0.489748 | 0.491314 | 18.2123 |
| 1 | 16000056 | -0.000702731 | 0.00226851 | 18.6109 | 16000055 | -0.489232 | 0.490798 | 18.6194 |
| 2 | 16000057 | -0.000138998 | 0.00170478 | 18.5498 | 16000050 | -0.488286 | 0.489852 | 18.5415 |
| 3 | 16000049 | 0.00000 | 0.00156578 | 18.5075 | 16000058 | -0.487788 | 0.489354 | 18.4786 |
| 4 | 16000052 | 0.00151070 | 5.50800e-05 | 18.4397 | 16000051 | -0.488081 | 0.489647 | 18.2791 |
| 5 | 16000060 | -0.000364261 | 0.00193004 | 17.8355 | 16000059 | -0.487742 | 0.489308 | 17.8985 |