| Red | Green | Blue | |
| z | 17.64 | ||
| znorm | Inf | ||
| sky | -Inf | -Inf | -Inf |
| S/N | 14.4 | 27.2 | 27.8 |
| S/N(c) | 0.0 | 0.0 | 0.0 |
| SN(E/C) |
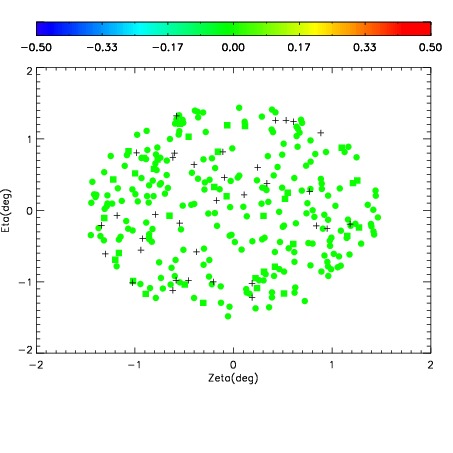
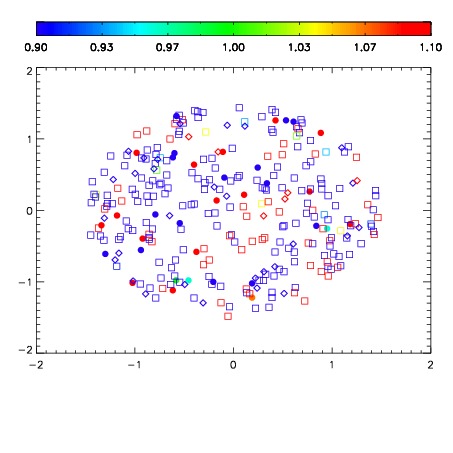
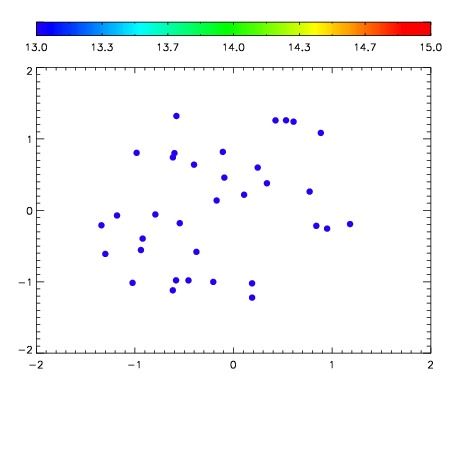

| Frame | Nreads | Zeropoints | Mag plots | Spatial mag deviation | Spatial sky 16325A emission deviations (filled: sky, open: star) | Spatial sky continuum emission | Spatial sky telluric CO2 absorption deviations (filled: H < 10) | |||||||||||||||||||||||
| 0 | 0 |
|
|
|
|
|
|
| IPAIR | NAME | SHIFT | NEWSHIFT | S/N | NAME | SHIFT | NEWSHIFT | S/N |
| 0 | 16020012 | 0.489422 | 0.00000 | 18.0641 | 16020013 | 0.00153883 | 0.487883 | 18.1414 |
| 1 | 16020011 | 0.488553 | 0.000869006 | 18.3977 | 16020010 | 0.00000 | 0.489422 | 18.2679 |
| 2 | 16020015 | 0.487568 | 0.00185400 | 18.2387 | 16020014 | 0.000558296 | 0.488864 | 18.2665 |