| Red | Green | Blue | |
| z | 17.64 | ||
| znorm | Inf | ||
| sky | -Inf | -NaN | -NaN |
| S/N | 33.6 | 61.0 | 63.0 |
| S/N(c) | 0.0 | 0.0 | 0.0 |
| SN(E/C) |
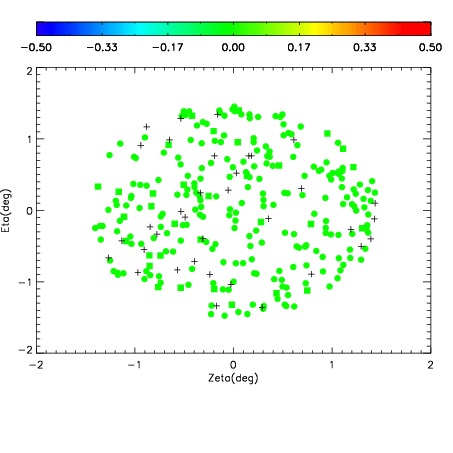
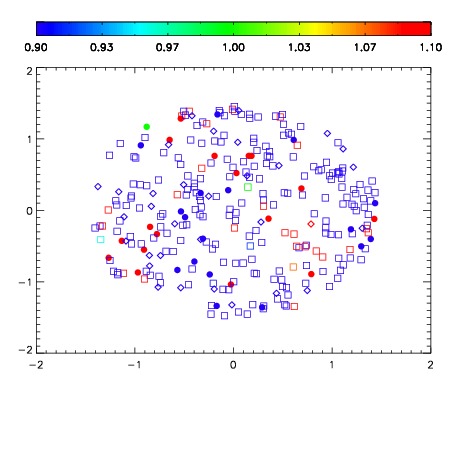


| Frame | Nreads | Zeropoints | Mag plots | Spatial mag deviation | Spatial sky 16325A emission deviations (filled: sky, open: star) | Spatial sky continuum emission | Spatial sky telluric CO2 absorption deviations (filled: H < 10) | |||||||||||||||||||||||
| 0 | 0 |
|
|
|
|
|
|
| IPAIR | NAME | SHIFT | NEWSHIFT | S/N | NAME | SHIFT | NEWSHIFT | S/N |
| 0 | 15710033 | 0.494406 | 0.00000 | 17.9032 | 15710034 | 0.00516400 | 0.489242 | 17.8675 |
| 1 | 15710016 | 0.487670 | 0.00673601 | 18.7782 | 15710015 | 0.000413122 | 0.493993 | 18.7502 |
| 2 | 15710029 | 0.492685 | 0.00172102 | 18.6666 | 15710030 | 0.00575524 | 0.488651 | 18.6175 |
| 3 | 15710032 | 0.494106 | 0.000300020 | 18.4629 | 15710031 | 0.00708141 | 0.487325 | 18.4046 |
| 4 | 15710028 | 0.492007 | 0.00239903 | 18.3102 | 15710022 | 0.00399496 | 0.490411 | 18.3827 |
| 5 | 15710021 | 0.490528 | 0.00387803 | 18.2852 | 15710027 | 0.00263072 | 0.491775 | 18.2799 |
| 6 | 15710020 | 0.491691 | 0.00271502 | 18.2569 | 15710026 | 0.00298355 | 0.491422 | 18.2322 |
| 7 | 15710017 | 0.489884 | 0.00452203 | 18.2392 | 15710018 | 0.00262564 | 0.491780 | 18.2124 |
| 8 | 15710024 | 0.490837 | 0.00356901 | 18.2298 | 15710019 | 0.00295023 | 0.491456 | 18.1982 |
| 9 | 15710012 | 0.489603 | 0.00480300 | 18.0877 | 15710011 | 0.00000 | 0.494406 | 18.1385 |
| 10 | 15710013 | 0.490864 | 0.00354201 | 18.0588 | 15710014 | 0.00211702 | 0.492289 | 18.1101 |
| 11 | 15710025 | 0.493809 | 0.000597000 | 17.3506 | 15710023 | 0.00531606 | 0.489090 | 17.5198 |