| Red | Green | Blue | |
| z | 17.64 | ||
| znorm | Inf | ||
| sky | -Inf | -NaN | -NaN |
| S/N | 29.1 | 50.2 | 57.7 |
| S/N(c) | 0.0 | 0.0 | 0.0 |
| SN(E/C) |
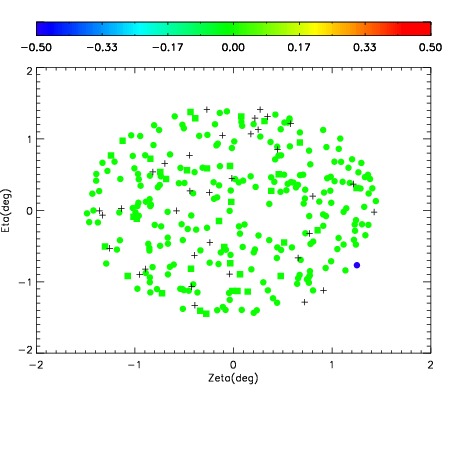
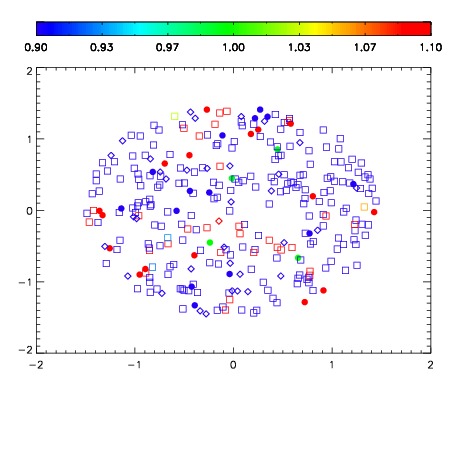
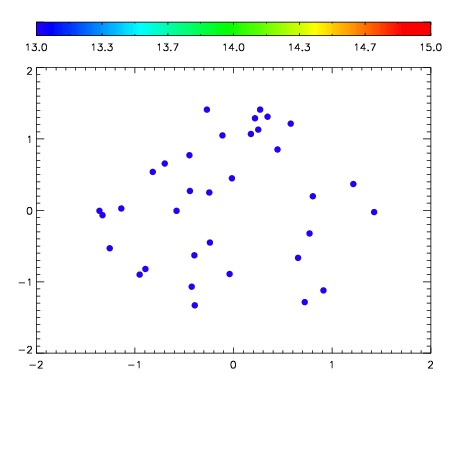

| Frame | Nreads | Zeropoints | Mag plots | Spatial mag deviation | Spatial sky 16325A emission deviations (filled: sky, open: star) | Spatial sky continuum emission | Spatial sky telluric CO2 absorption deviations (filled: H < 10) | |||||||||||||||||||||||
| 0 | 0 |
|
|
|
|
|
|
| IPAIR | NAME | SHIFT | NEWSHIFT | S/N | NAME | SHIFT | NEWSHIFT | S/N |
| 0 | 19570041 | 0.498090 | 0.00000 | 18.4922 | 19570042 | 0.00203892 | 0.496051 | 18.4910 |
| 1 | 19570053 | 0.492214 | 0.00587600 | 18.6214 | 19570047 | -0.00288422 | 0.500974 | 18.5756 |
| 2 | 19570048 | 0.491916 | 0.00617400 | 18.6115 | 19570054 | -0.00225492 | 0.500345 | 18.4923 |
| 3 | 19570044 | 0.495493 | 0.00259700 | 18.3272 | 19570043 | 0.00182633 | 0.496264 | 18.4024 |
| 4 | 19570052 | 0.492397 | 0.00569299 | 18.2795 | 19570046 | -0.00319903 | 0.501289 | 18.3316 |
| 5 | 19570045 | 0.496562 | 0.00152799 | 18.2225 | 19570051 | -0.00100547 | 0.499095 | 18.2583 |
| 6 | 19570040 | 0.497406 | 0.000683993 | 18.1690 | 19570039 | 0.00000 | 0.498090 | 18.0951 |
| 7 | 19570049 | 0.492282 | 0.00580800 | 18.1404 | 19570050 | -0.00111373 | 0.499204 | 18.0676 |
| 8 | 19570056 | 0.491939 | 0.00615099 | 17.6575 | 19570055 | -0.00239033 | 0.500480 | 17.7148 |