| Red | Green | Blue | |
| z | 17.64 | ||
| znorm | Inf | ||
| sky | -Inf | -Inf | -NaN |
| S/N | 21.7 | 39.6 | 40.2 |
| S/N(c) | 0.0 | 0.0 | 0.0 |
| SN(E/C) |
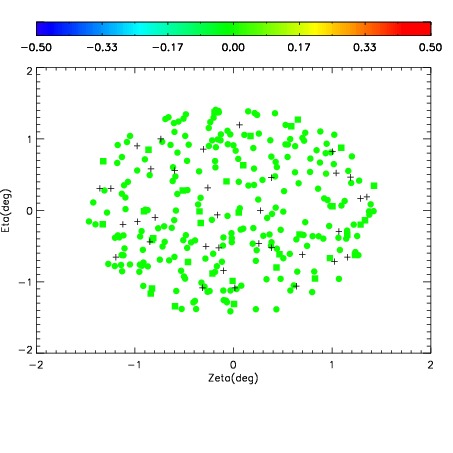
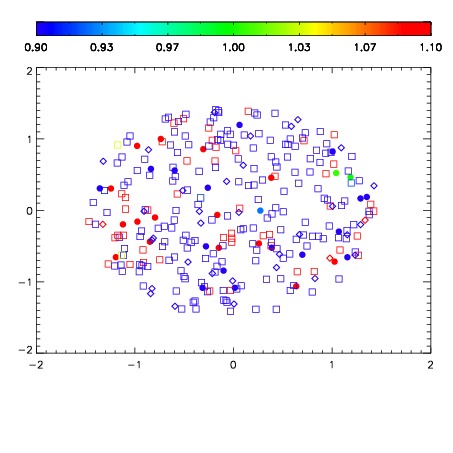
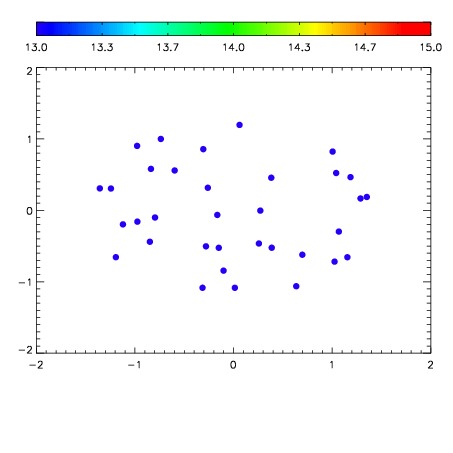

| Frame | Nreads | Zeropoints | Mag plots | Spatial mag deviation | Spatial sky 16325A emission deviations (filled: sky, open: star) | Spatial sky continuum emission | Spatial sky telluric CO2 absorption deviations (filled: H < 10) | |||||||||||||||||||||||
| 0 | 0 |
|
|
|
|
|
|
| IPAIR | NAME | SHIFT | NEWSHIFT | S/N | NAME | SHIFT | NEWSHIFT | S/N |
| 0 | 15900032 | 0.00194777 | 0.00000 | 17.9438 | 15900033 | -0.487039 | 0.488987 | 18.0283 |
| 1 | 15900028 | 0.00000 | 0.00194777 | 18.5806 | 15900034 | -0.486884 | 0.488832 | 18.6047 |
| 2 | 15900035 | 0.000111919 | 0.00183585 | 18.5475 | 15900029 | -0.486805 | 0.488753 | 18.5544 |
| 3 | 15900036 | 0.00134584 | 0.000601930 | 18.3562 | 15900037 | -0.487318 | 0.489266 | 18.3379 |
| 4 | 15900031 | 0.00191302 | 3.47500e-05 | 18.3045 | 15900030 | -0.487043 | 0.488991 | 18.3191 |
| 5 | 15900039 | -0.000238270 | 0.00218604 | 17.9005 | 15900038 | -0.487147 | 0.489095 | 17.8830 |