| Red | Green | Blue | |
| z | 17.64 | ||
| znorm | 13.58 | ||
| sky | 22.8 | -NaN | -NaN |
| S/N | 4.7 | 9.8 | 9.8 |
| S/N(c) | 0.0 | 0.0 | 0.0 |
| SN(E/C) |
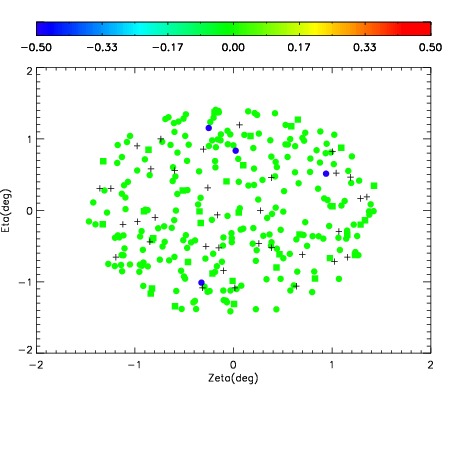
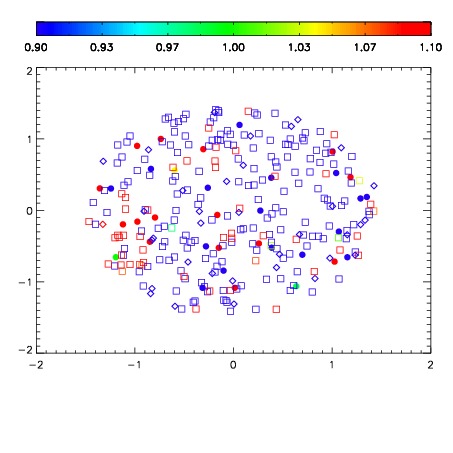
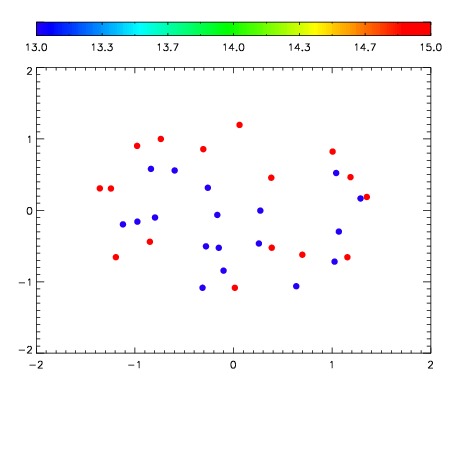

| Frame | Nreads | Zeropoints | Mag plots | Spatial mag deviation | Spatial sky 16325A emission deviations (filled: sky, open: star) | Spatial sky continuum emission | Spatial sky telluric CO2 absorption deviations (filled: H < 10) | |||||||||||||||||||||||
| 0 | 42 |
|
|
|
|
|
|
| IPAIR | NAME | SHIFT | NEWSHIFT | S/N | NAME | SHIFT | NEWSHIFT | S/N |
| 0 | 15910041 | 0.00000 | 0.00000 | 18.6192 | 15910042 | -0.489052 | 0.489052 | 18.6392 |