| Red | Green | Blue | |
| z | 17.64 | ||
| znorm | Inf | ||
| sky | -Inf | -NaN | -Inf |
| S/N | 24.8 | 45.6 | 46.6 |
| S/N(c) | 0.0 | 0.0 | 0.0 |
| SN(E/C) |

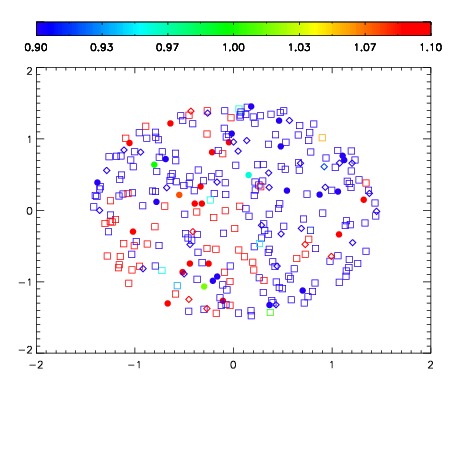
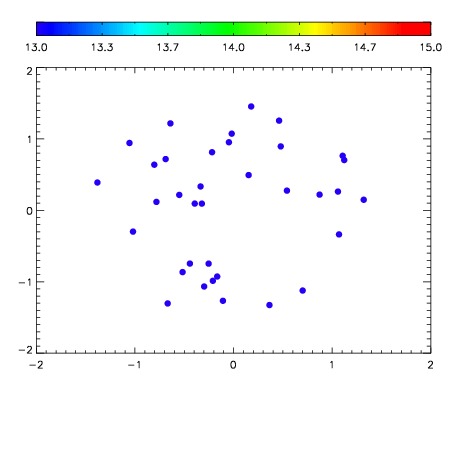

| Frame | Nreads | Zeropoints | Mag plots | Spatial mag deviation | Spatial sky 16325A emission deviations (filled: sky, open: star) | Spatial sky continuum emission | Spatial sky telluric CO2 absorption deviations (filled: H < 10) | |||||||||||||||||||||||
| 0 | 0 |
|
|
|
|
|
|
| IPAIR | NAME | SHIFT | NEWSHIFT | S/N | NAME | SHIFT | NEWSHIFT | S/N |
| 0 | 15690054 | 0.00236437 | 0.00000 | 18.4017 | 15690048 | -0.486064 | 0.488428 | 18.3681 |
| 1 | 15690050 | 0.000825778 | 0.00153859 | 18.5319 | 15690059 | -0.485800 | 0.488164 | 18.5091 |
| 2 | 15690053 | 0.00172891 | 0.000635460 | 18.4523 | 15690051 | -0.487353 | 0.489717 | 18.4894 |
| 3 | 15690058 | 0.00202758 | 0.000336790 | 18.4314 | 15690052 | -0.487364 | 0.489728 | 18.3962 |
| 4 | 15690049 | 0.00192682 | 0.000437550 | 18.3571 | 15690055 | -0.485871 | 0.488235 | 18.3253 |
| 5 | 15690046 | 0.00000 | 0.00236437 | 18.2531 | 15690056 | -0.486082 | 0.488446 | 18.2253 |
| 6 | 15690057 | 0.00168071 | 0.000683660 | 18.2438 | 15690047 | -0.485704 | 0.488068 | 18.2247 |