| Red | Green | Blue | |
| z | 17.65 | ||
| znorm | Inf | ||
| sky | -Inf | -Inf | -NaN |
| S/N | 21.6 | 39.0 | 39.4 |
| S/N(c) | 38.1 | 13.0 | 12.3 |
| SN(E/C) |
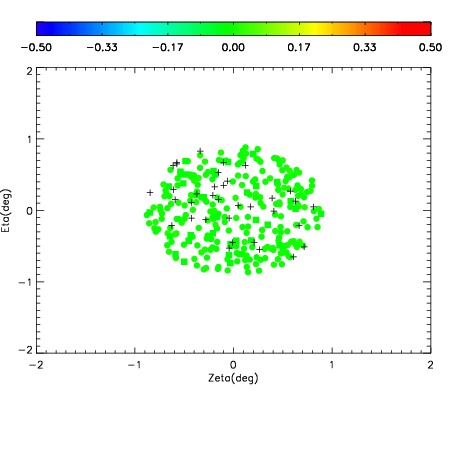
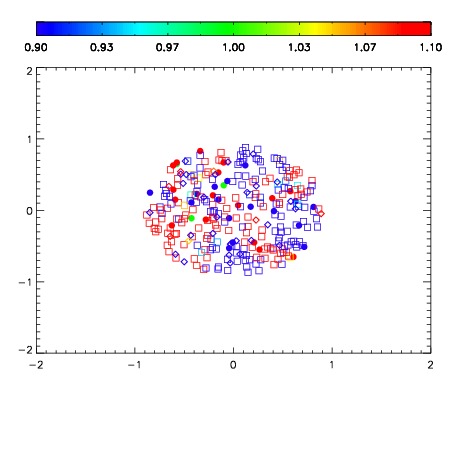


| Frame | Nreads | Zeropoints | Mag plots | Spatial mag deviation | Spatial sky 16325A emission deviations (filled: sky, open: star) | Spatial sky continuum emission | Spatial sky telluric CO2 absorption deviations (filled: H < 10) | |||||||||||||||||||||||
| 0 | 0 |
|
|
|
|
|
|
| IPAIR | NAME | SHIFT | NEWSHIFT | S/N | NAME | SHIFT | NEWSHIFT | S/N |
| 0 | 16090055 | 0.493848 | 0.00000 | 18.7828 | 16090052 | 0.00215082 | 0.491697 | 18.6940 |
| 1 | 16090054 | 0.493070 | 0.000777990 | 18.9866 | 16090053 | 0.00298215 | 0.490866 | 18.6963 |
| 2 | 16090051 | 0.492887 | 0.000961006 | 18.6111 | 16090056 | 0.00329969 | 0.490548 | 18.6468 |
| 3 | 16090050 | 0.492581 | 0.00126699 | 18.4620 | 16090049 | 0.00000 | 0.493848 | 18.4501 |