| Red | Green | Blue | |
| z | 17.64 | ||
| znorm | Inf | ||
| sky | -NaN | -Inf | -NaN |
| S/N | 22.2 | 39.5 | 43.0 |
| S/N(c) | 39.9 | 13.8 | 13.3 |
| SN(E/C) |
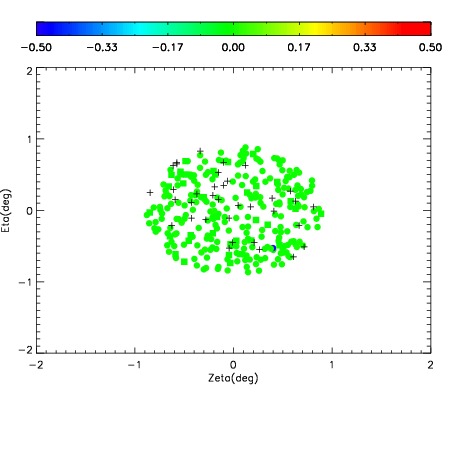
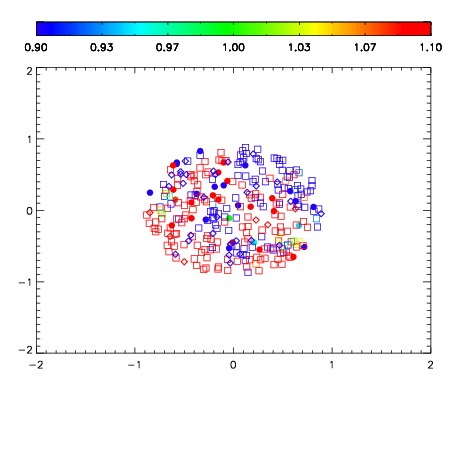
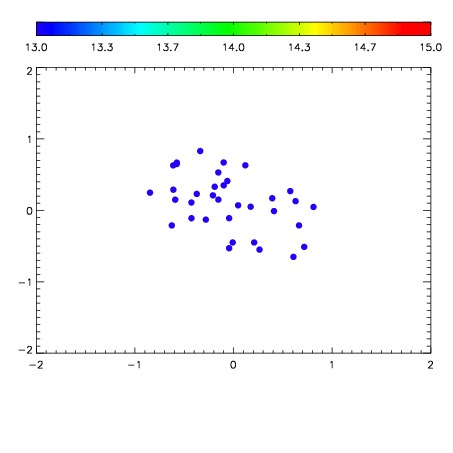

| Frame | Nreads | Zeropoints | Mag plots | Spatial mag deviation | Spatial sky 16325A emission deviations (filled: sky, open: star) | Spatial sky continuum emission | Spatial sky telluric CO2 absorption deviations (filled: H < 10) | |||||||||||||||||||||||
| 0 | 0 |
|
|
|
|
|
|
| IPAIR | NAME | SHIFT | NEWSHIFT | S/N | NAME | SHIFT | NEWSHIFT | S/N |
| 0 | 19180028 | 0.507918 | 0.00000 | 18.4507 | 19180022 | 0.00000 | 0.507918 | 18.5001 |
| 1 | 19180024 | 0.504863 | 0.00305498 | 18.6091 | 19180025 | 0.00184836 | 0.506070 | 18.6139 |
| 2 | 19180023 | 0.504495 | 0.00342298 | 18.6029 | 19180026 | 0.00201335 | 0.505905 | 18.5676 |
| 3 | 19180027 | 0.506802 | 0.00111598 | 18.5943 | 19180029 | 0.00409312 | 0.503825 | 18.5569 |